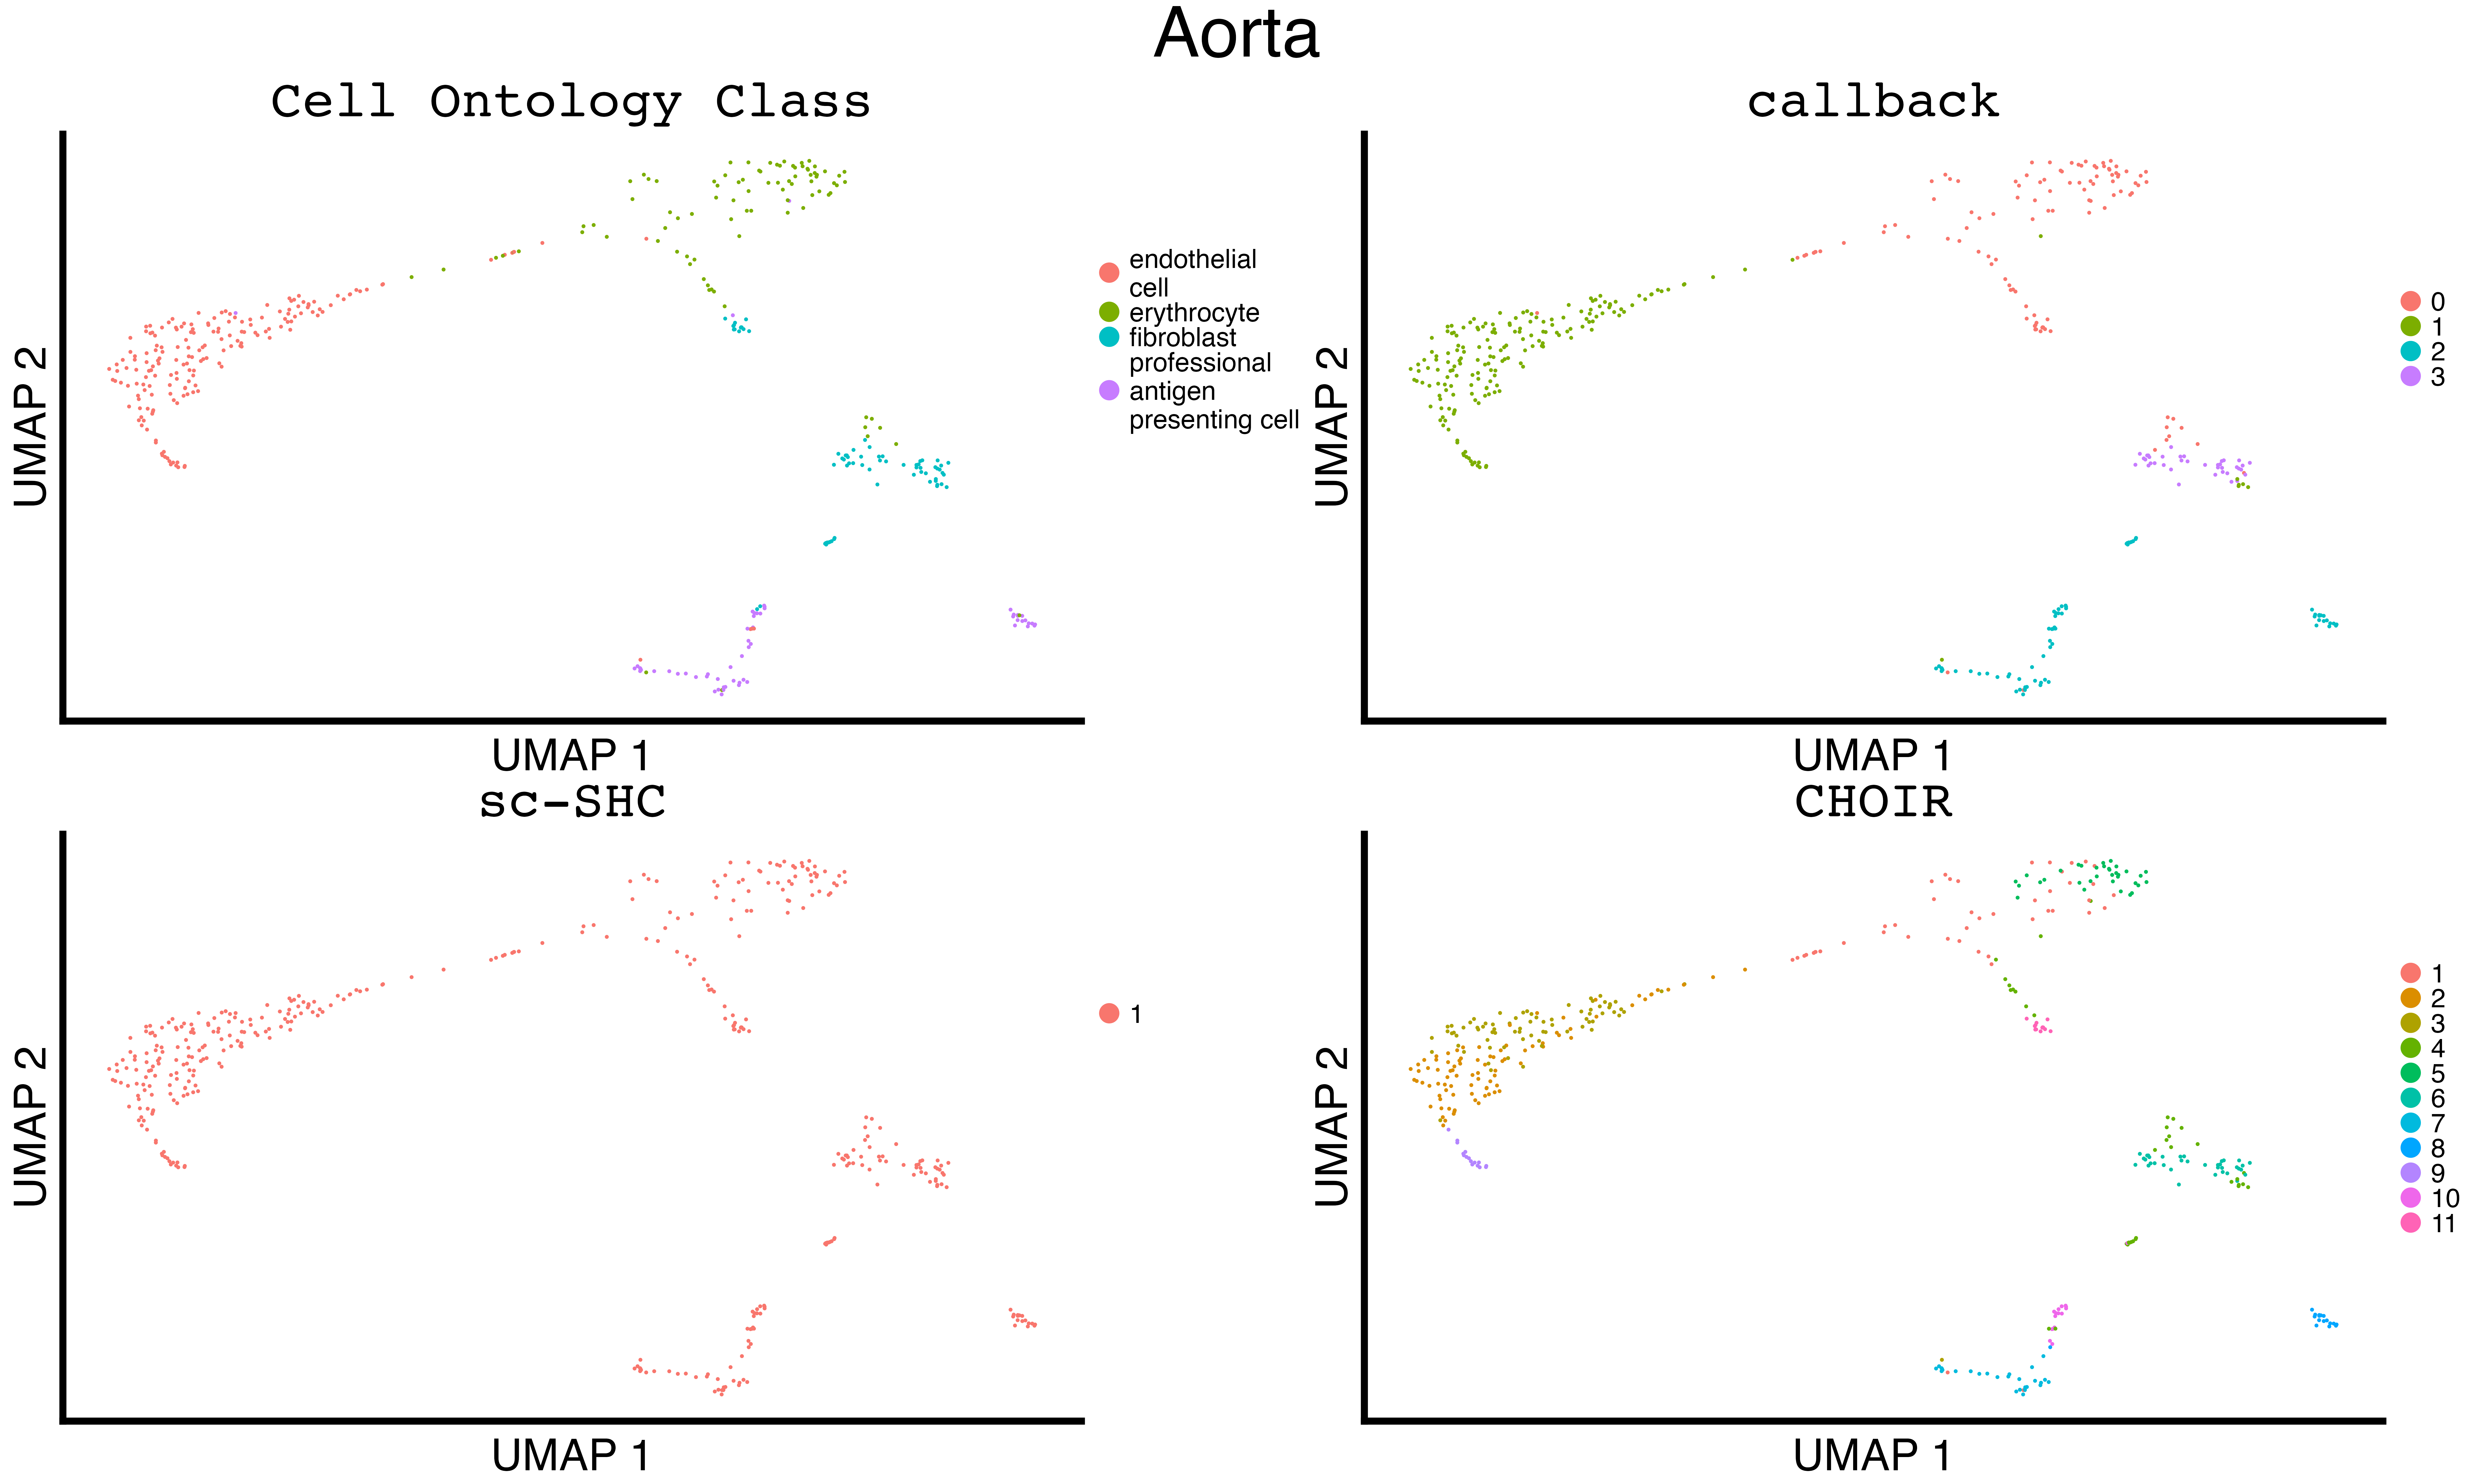
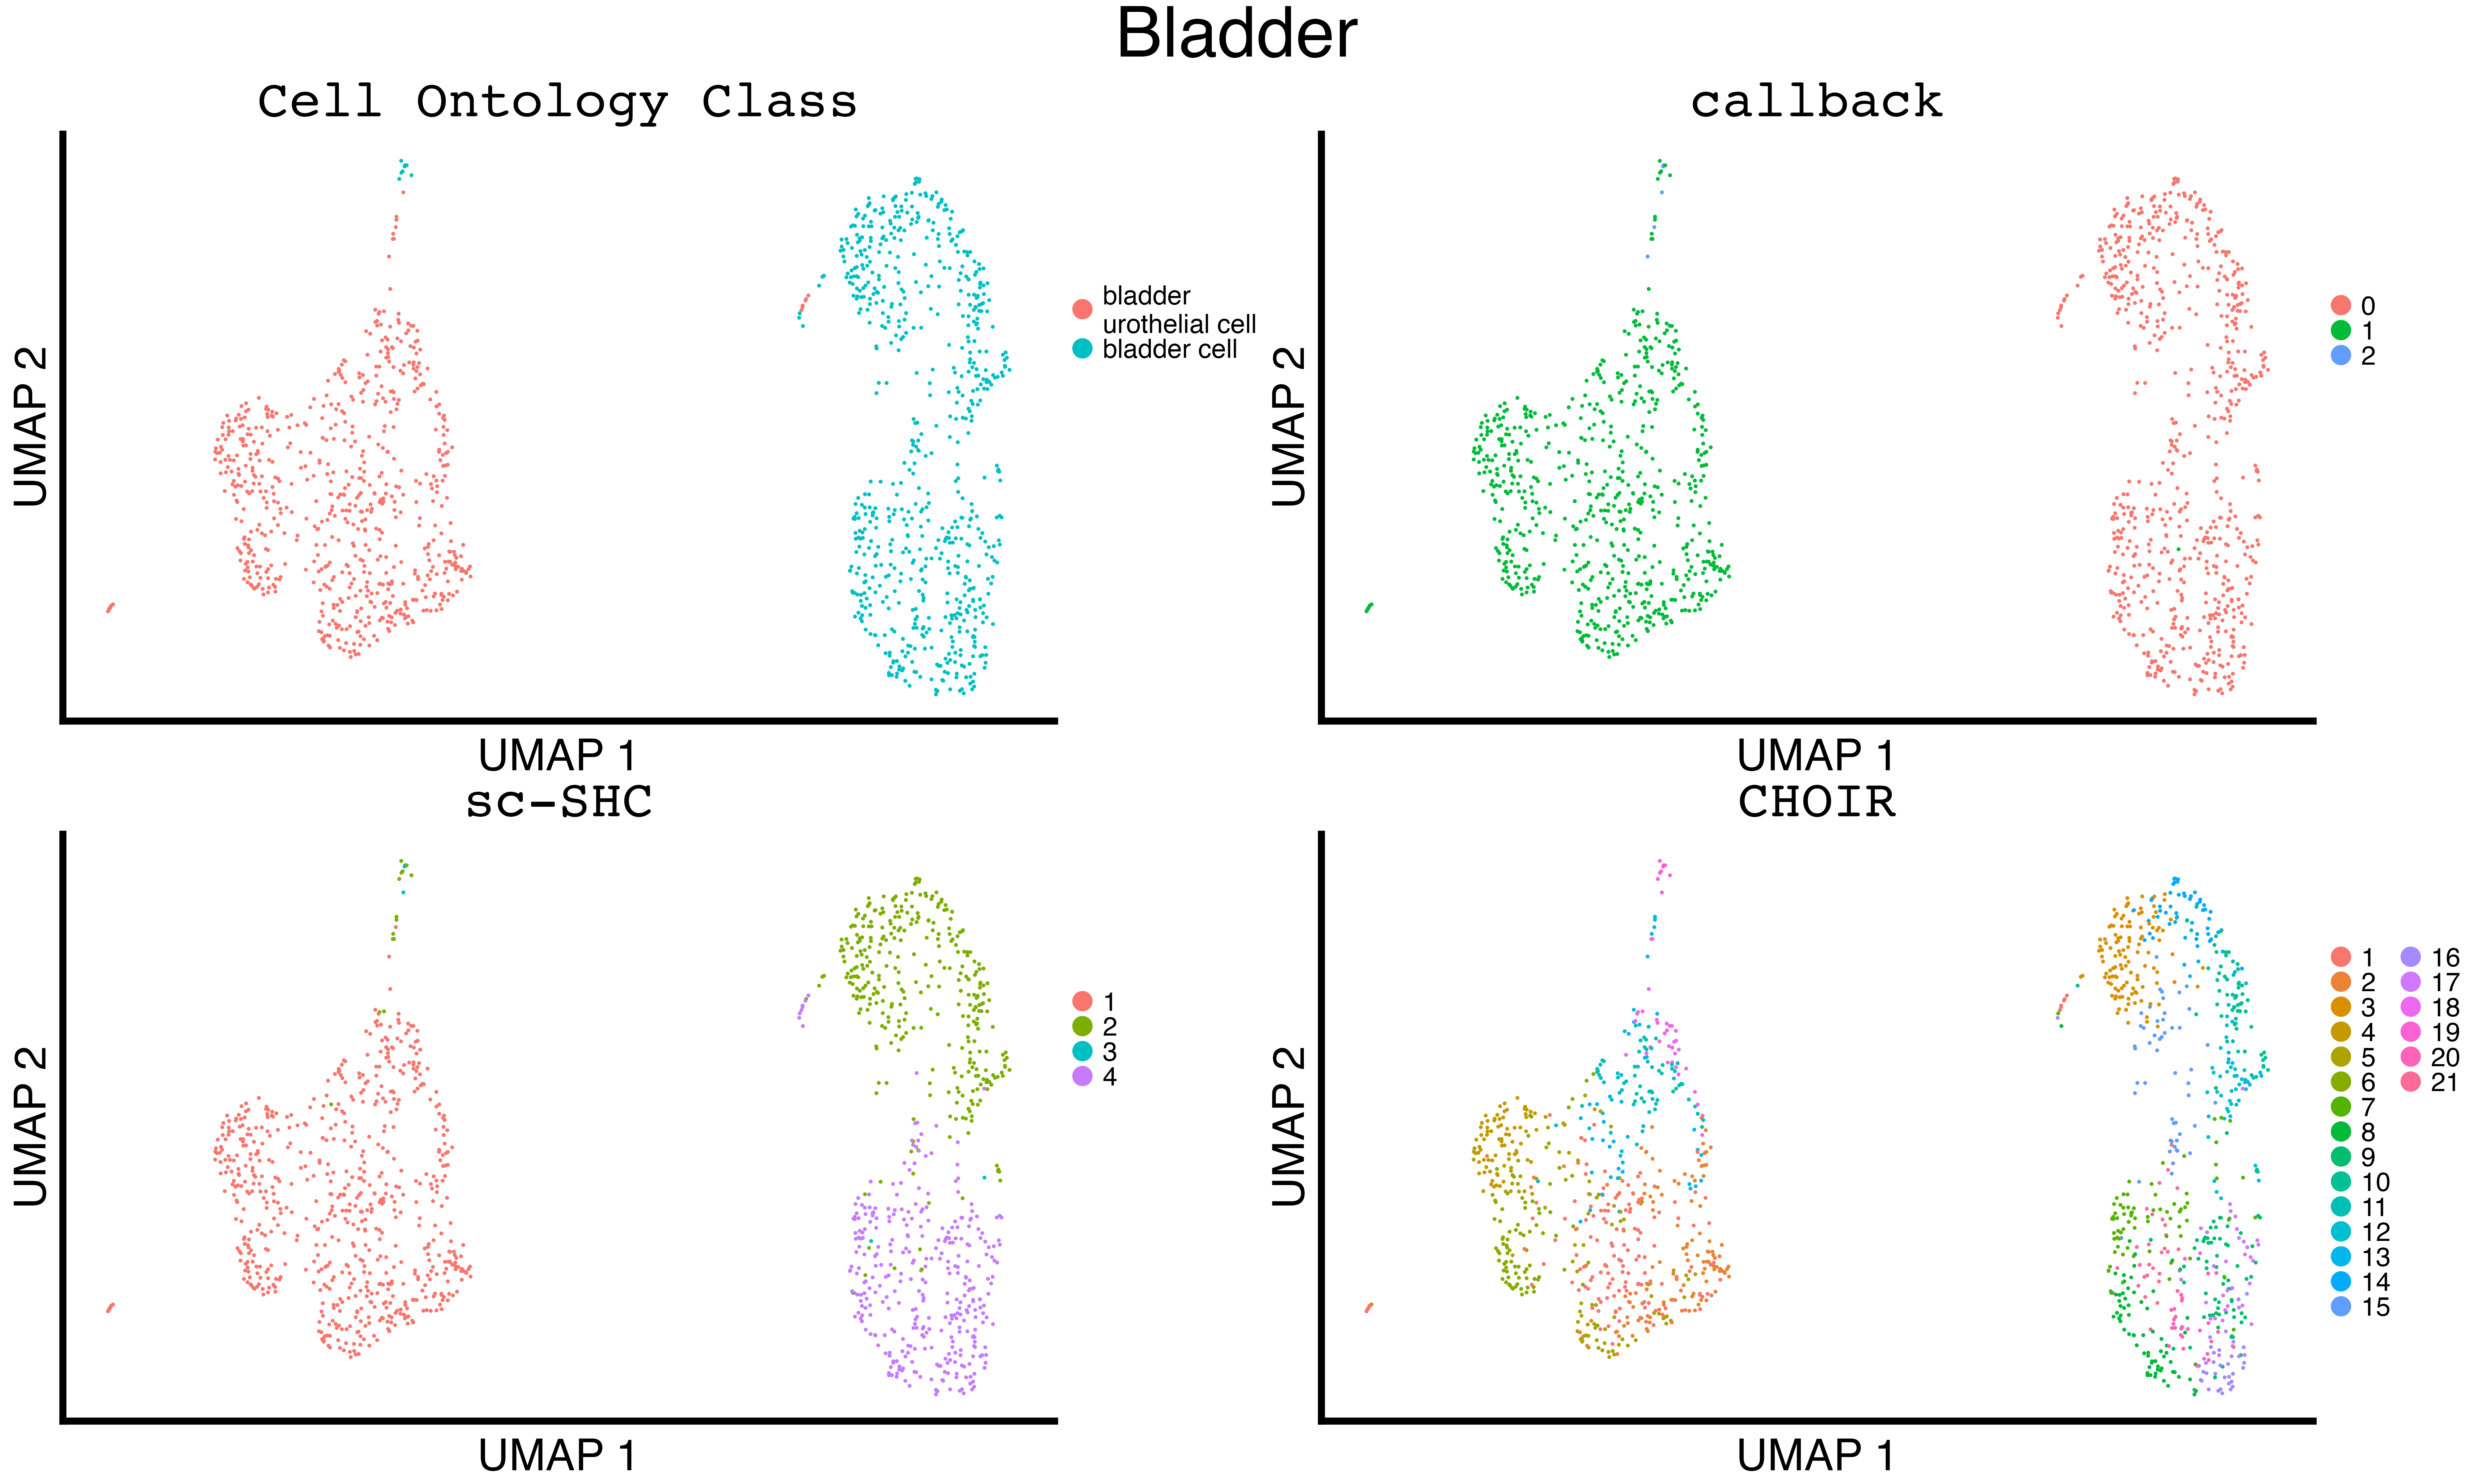
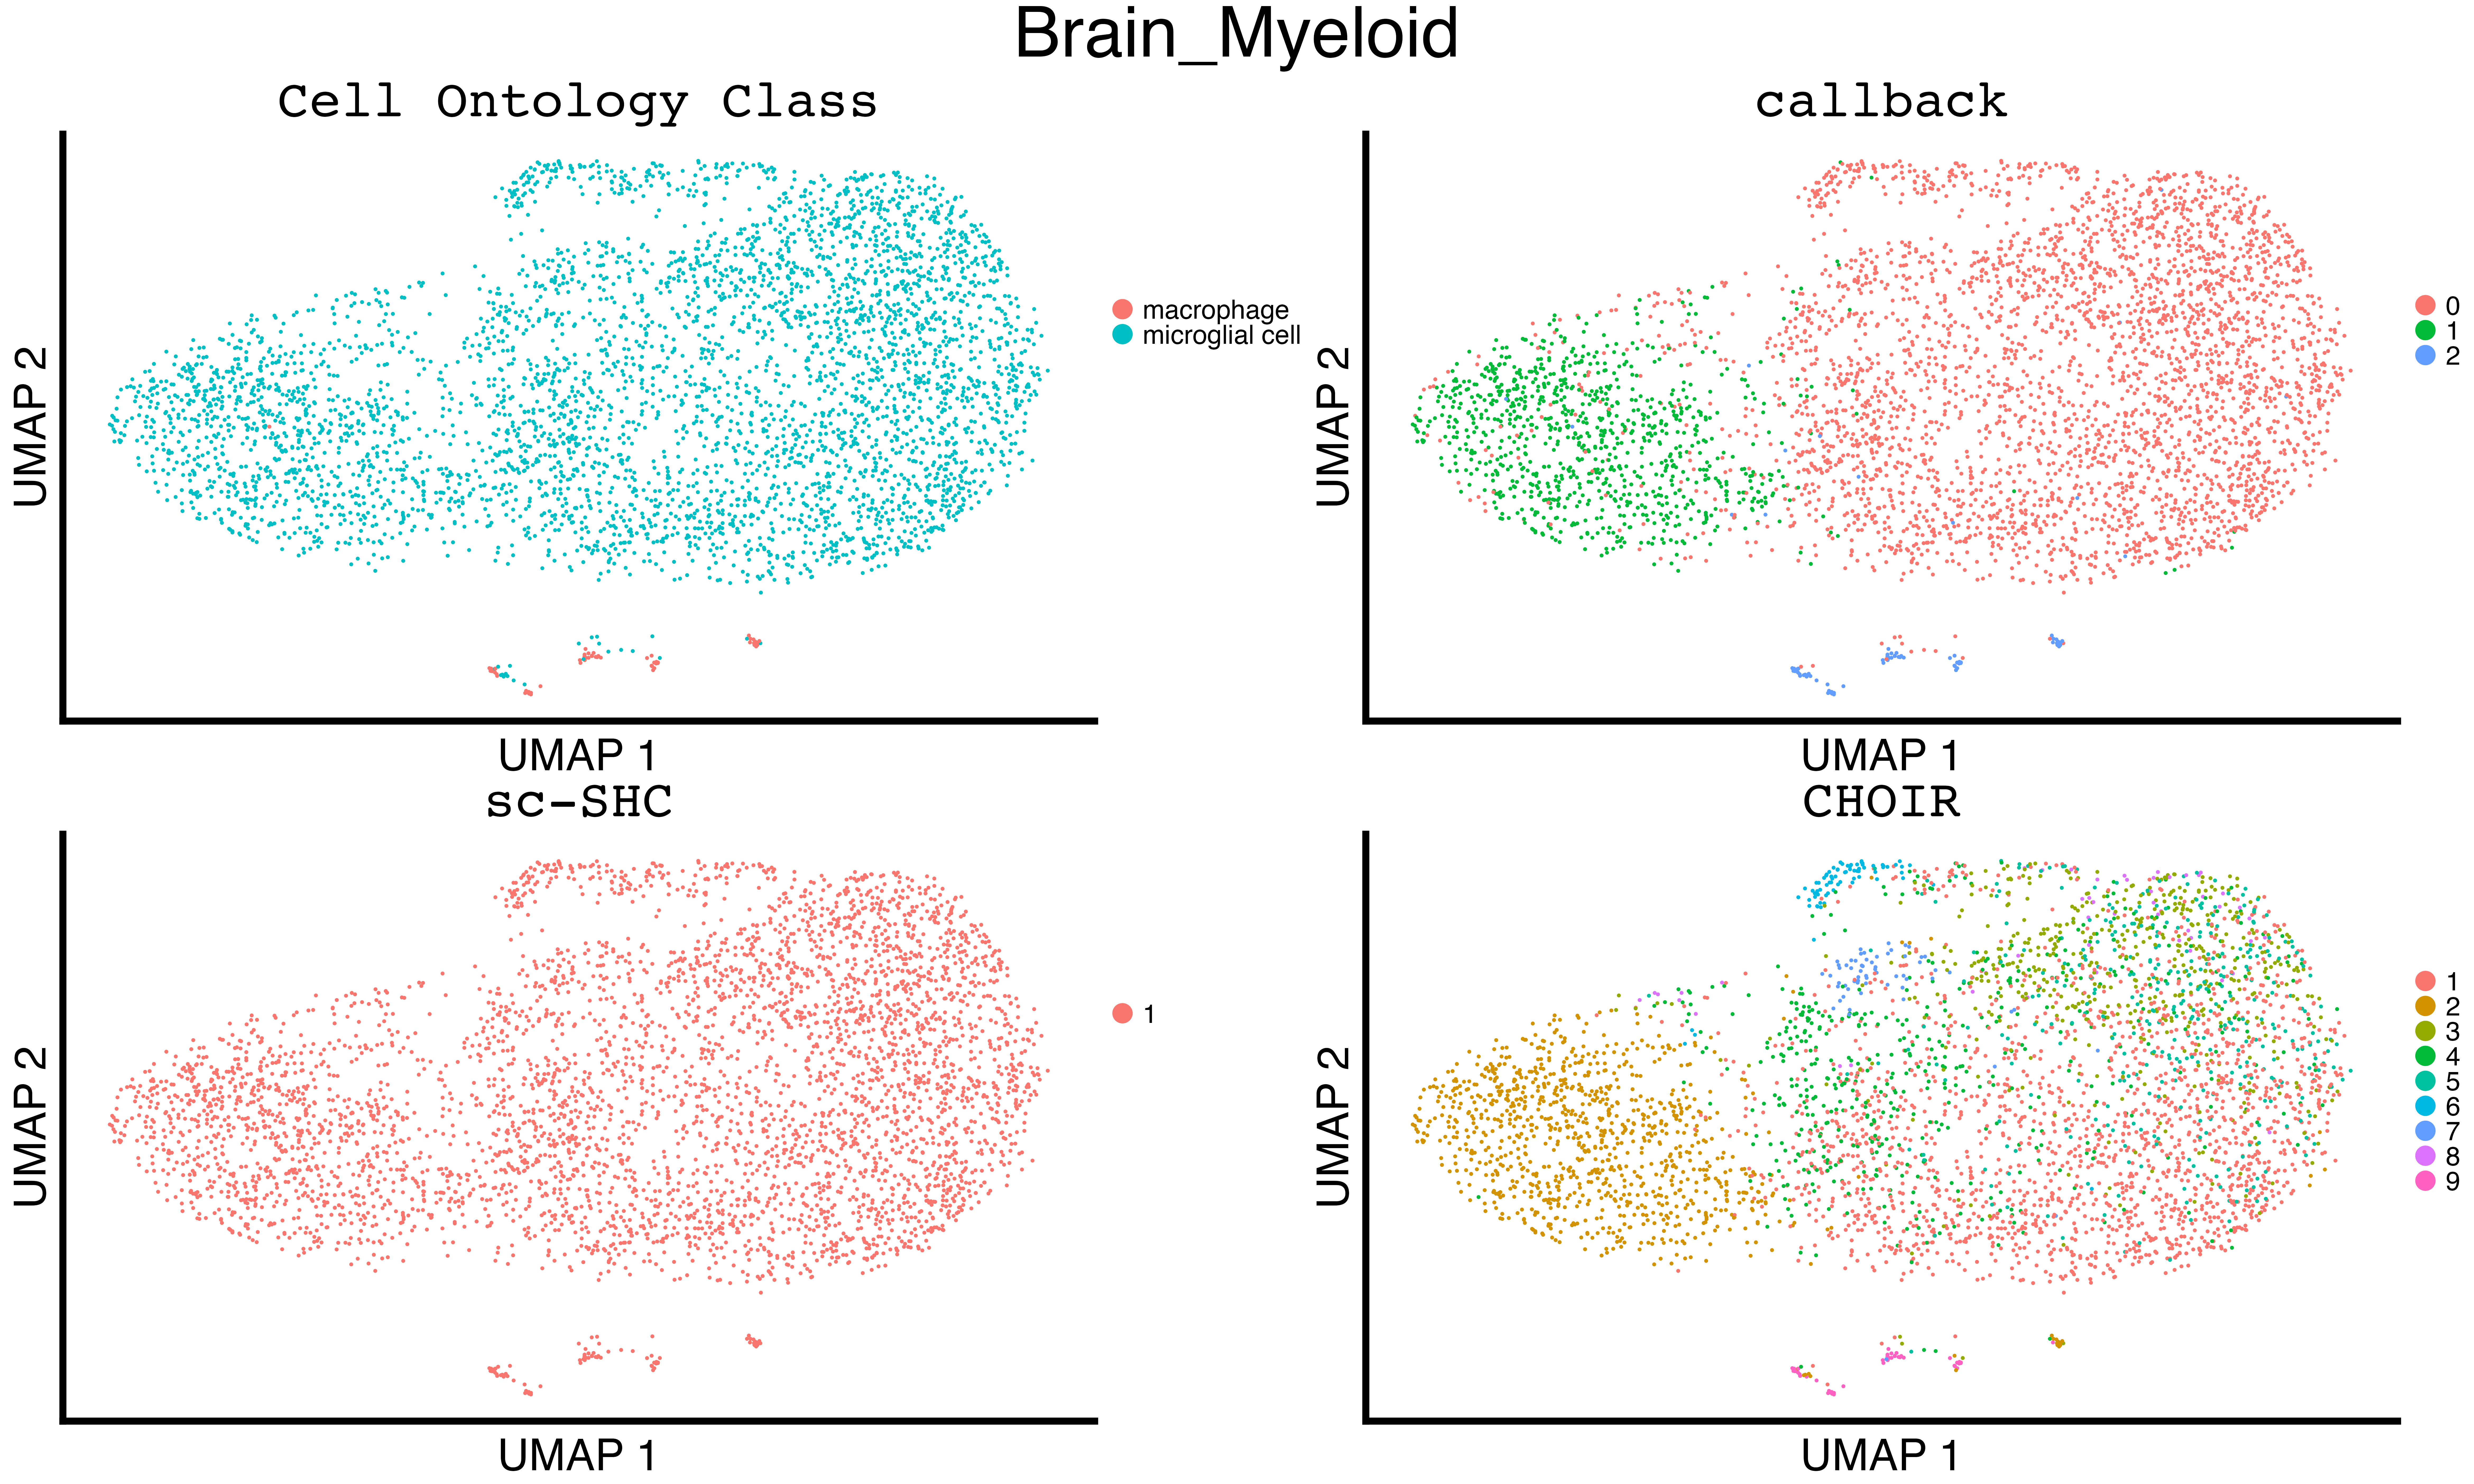
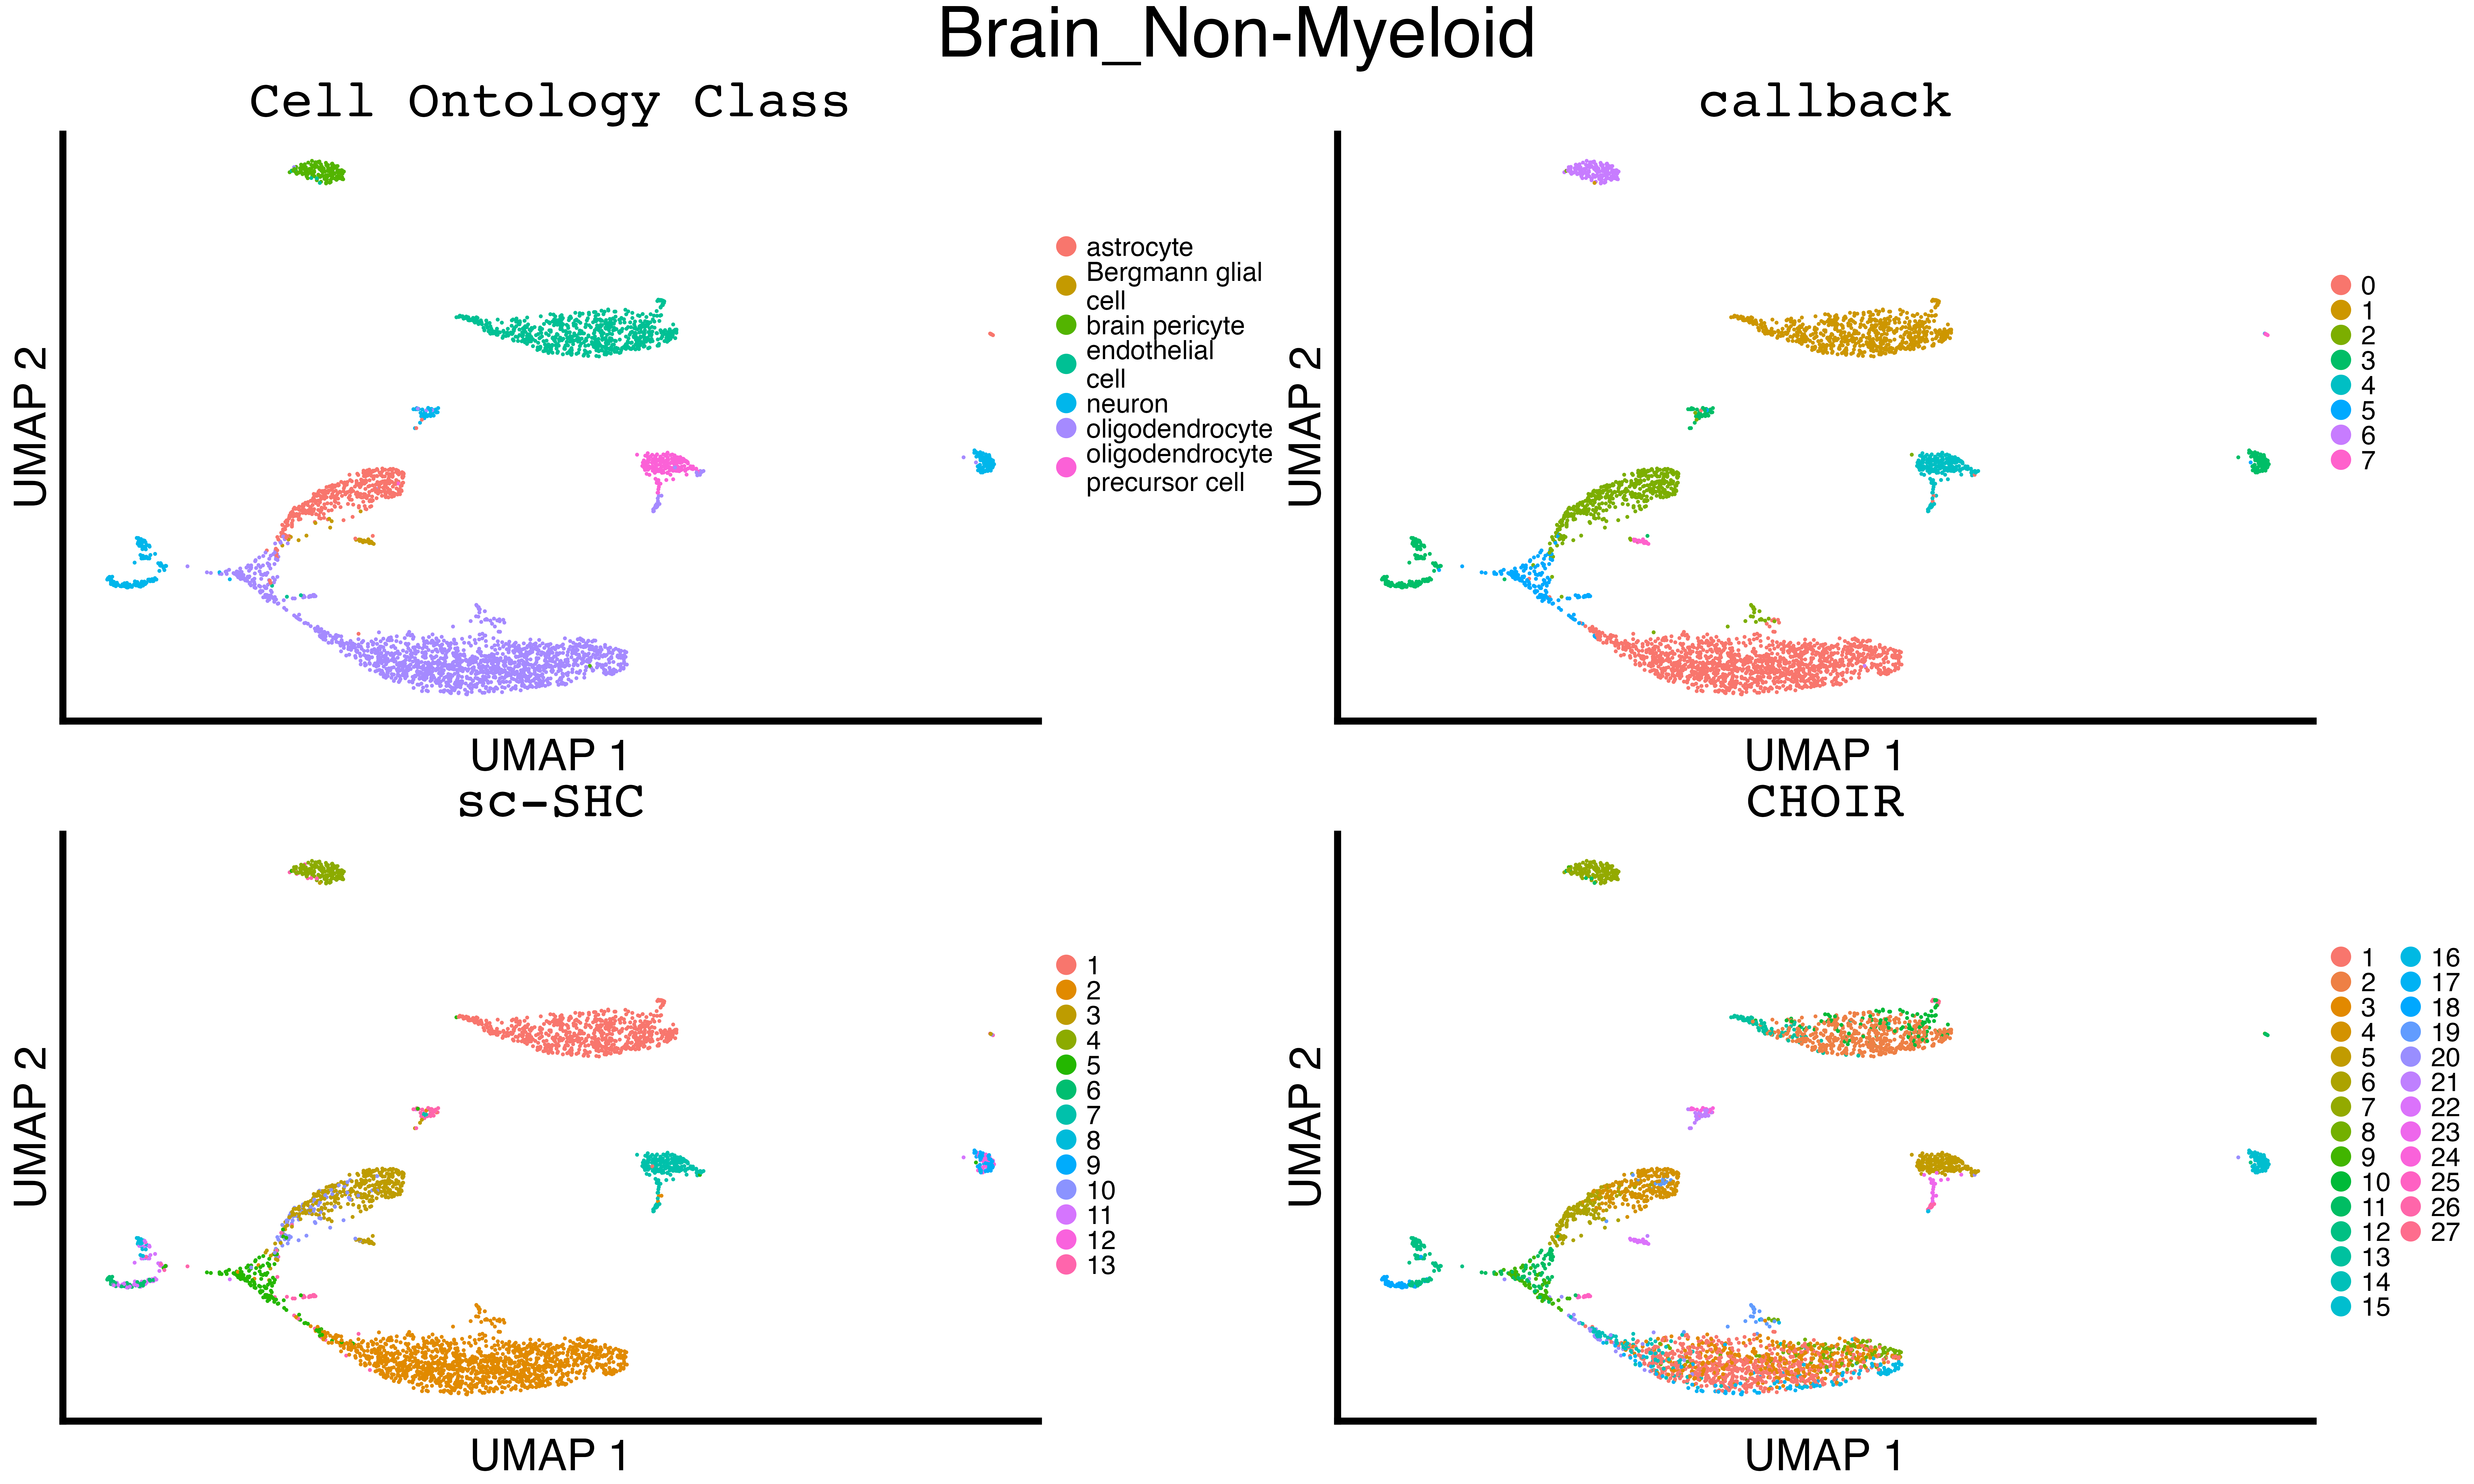
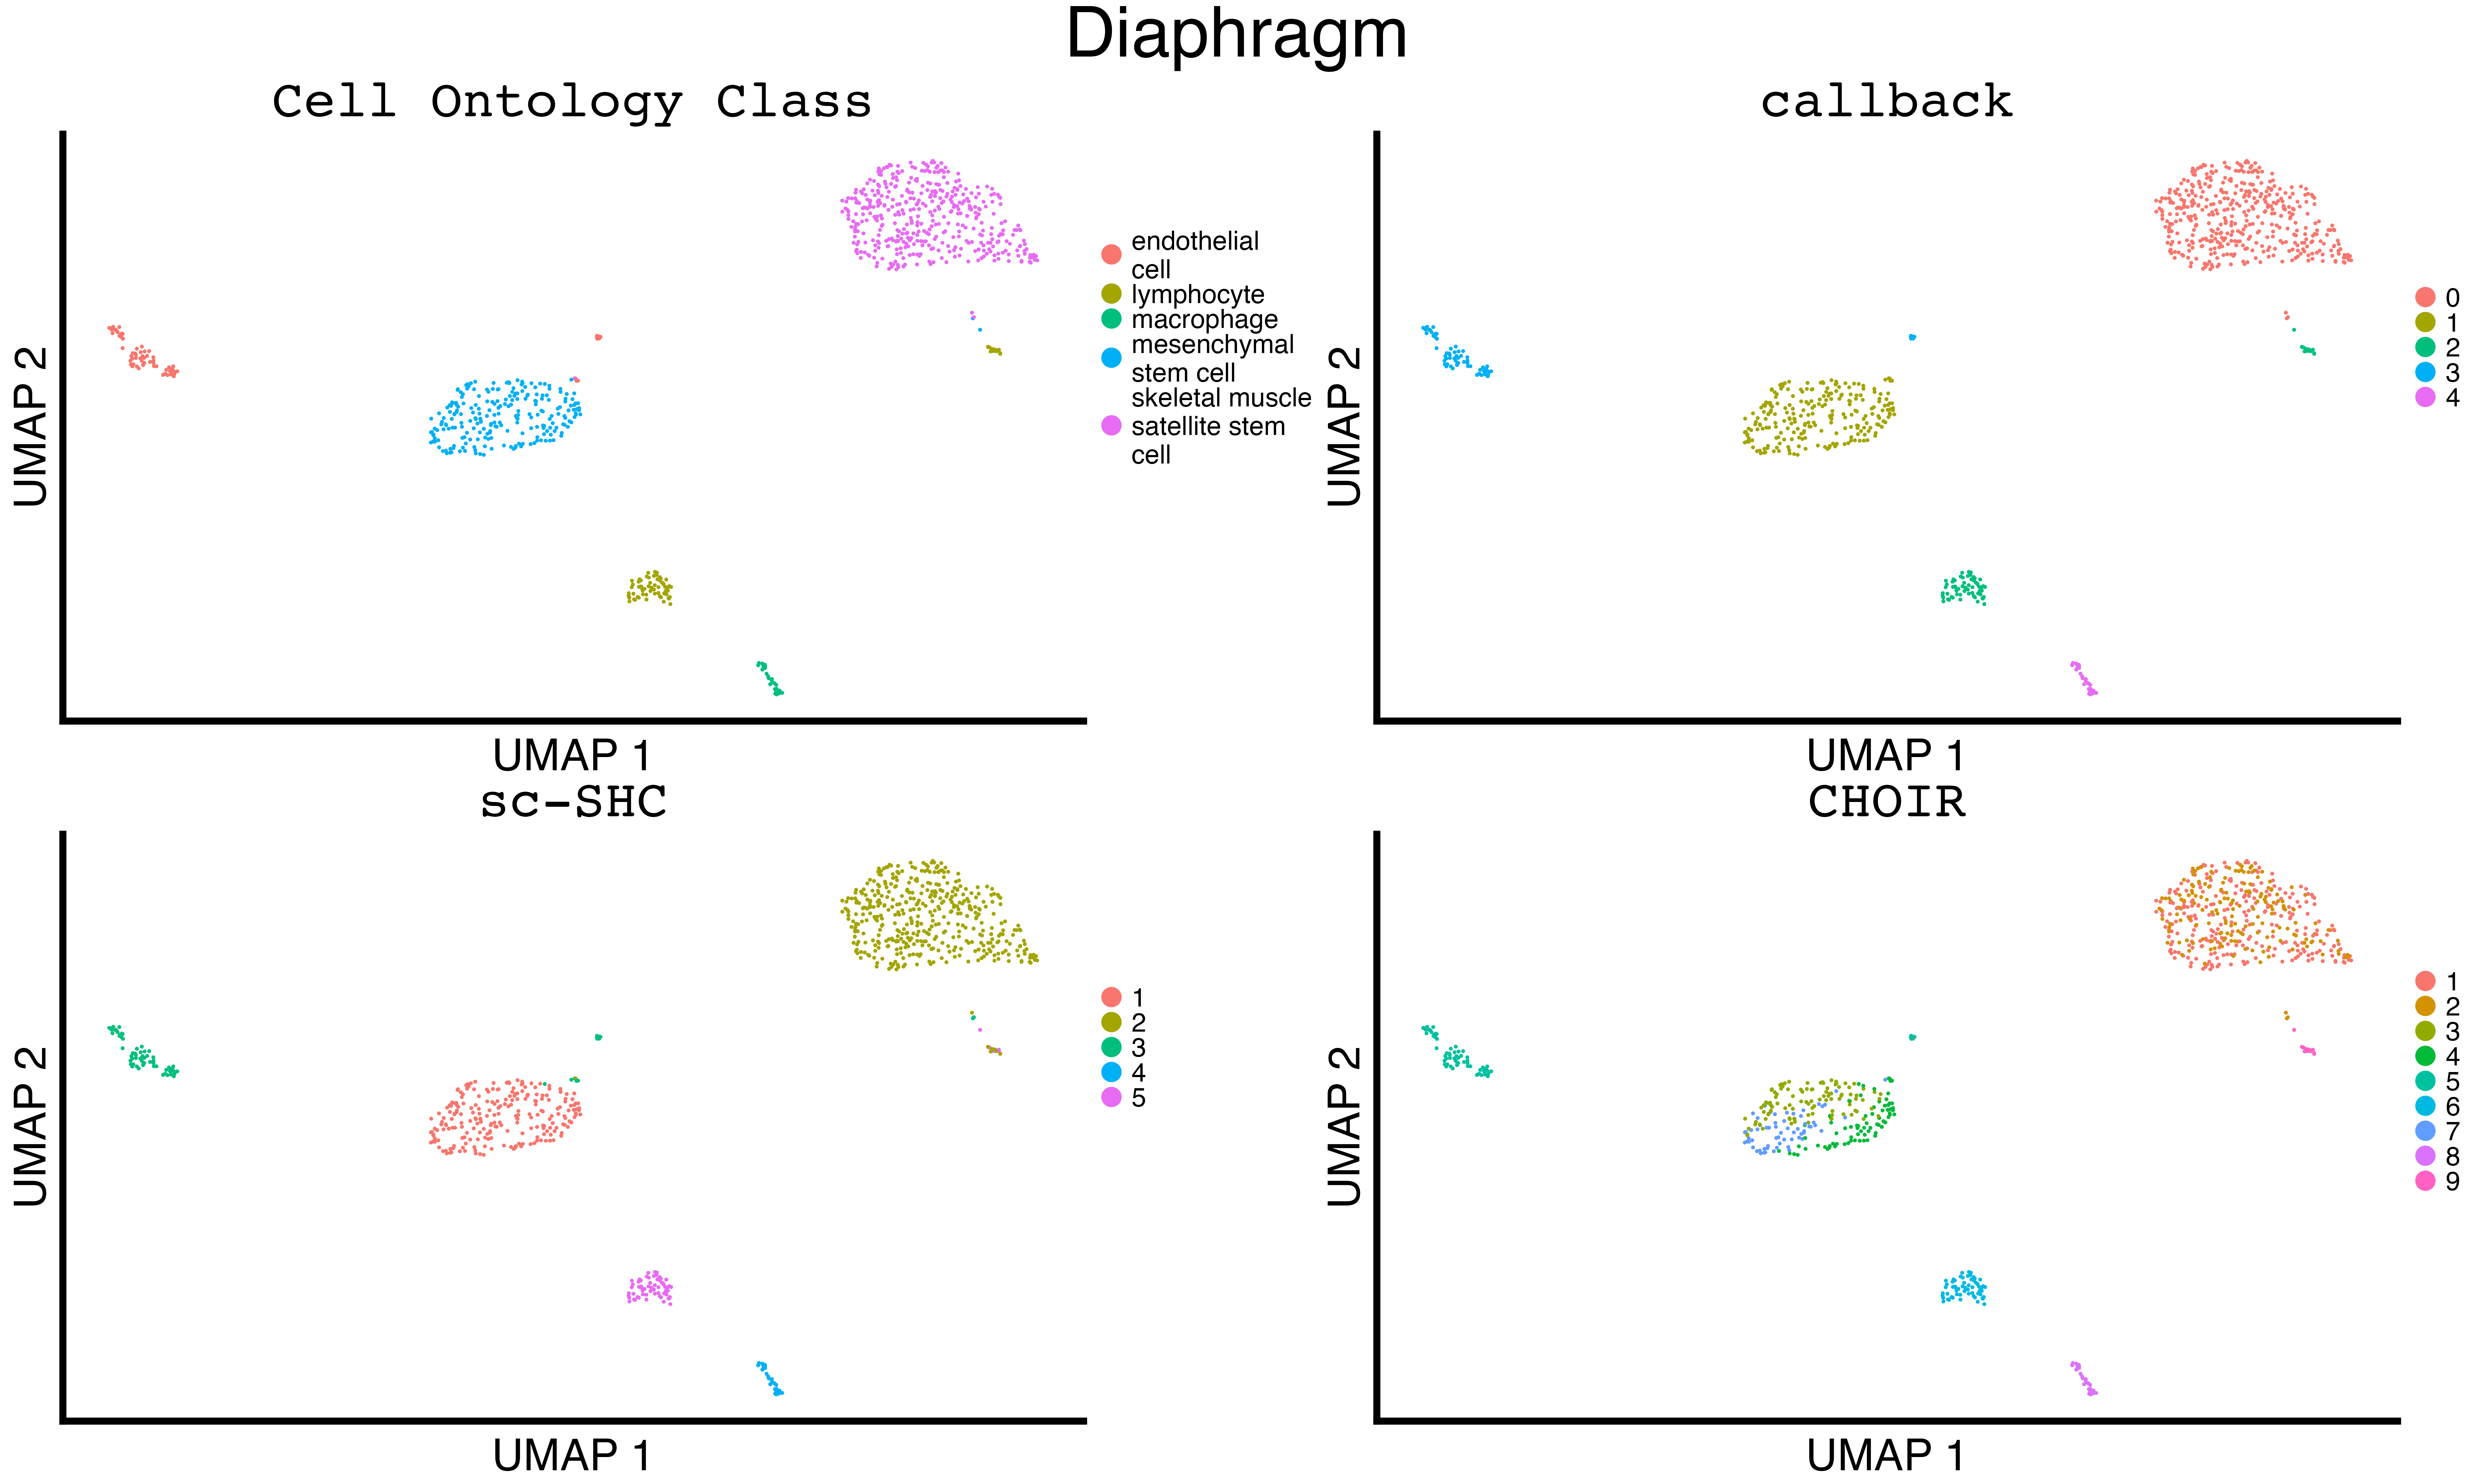
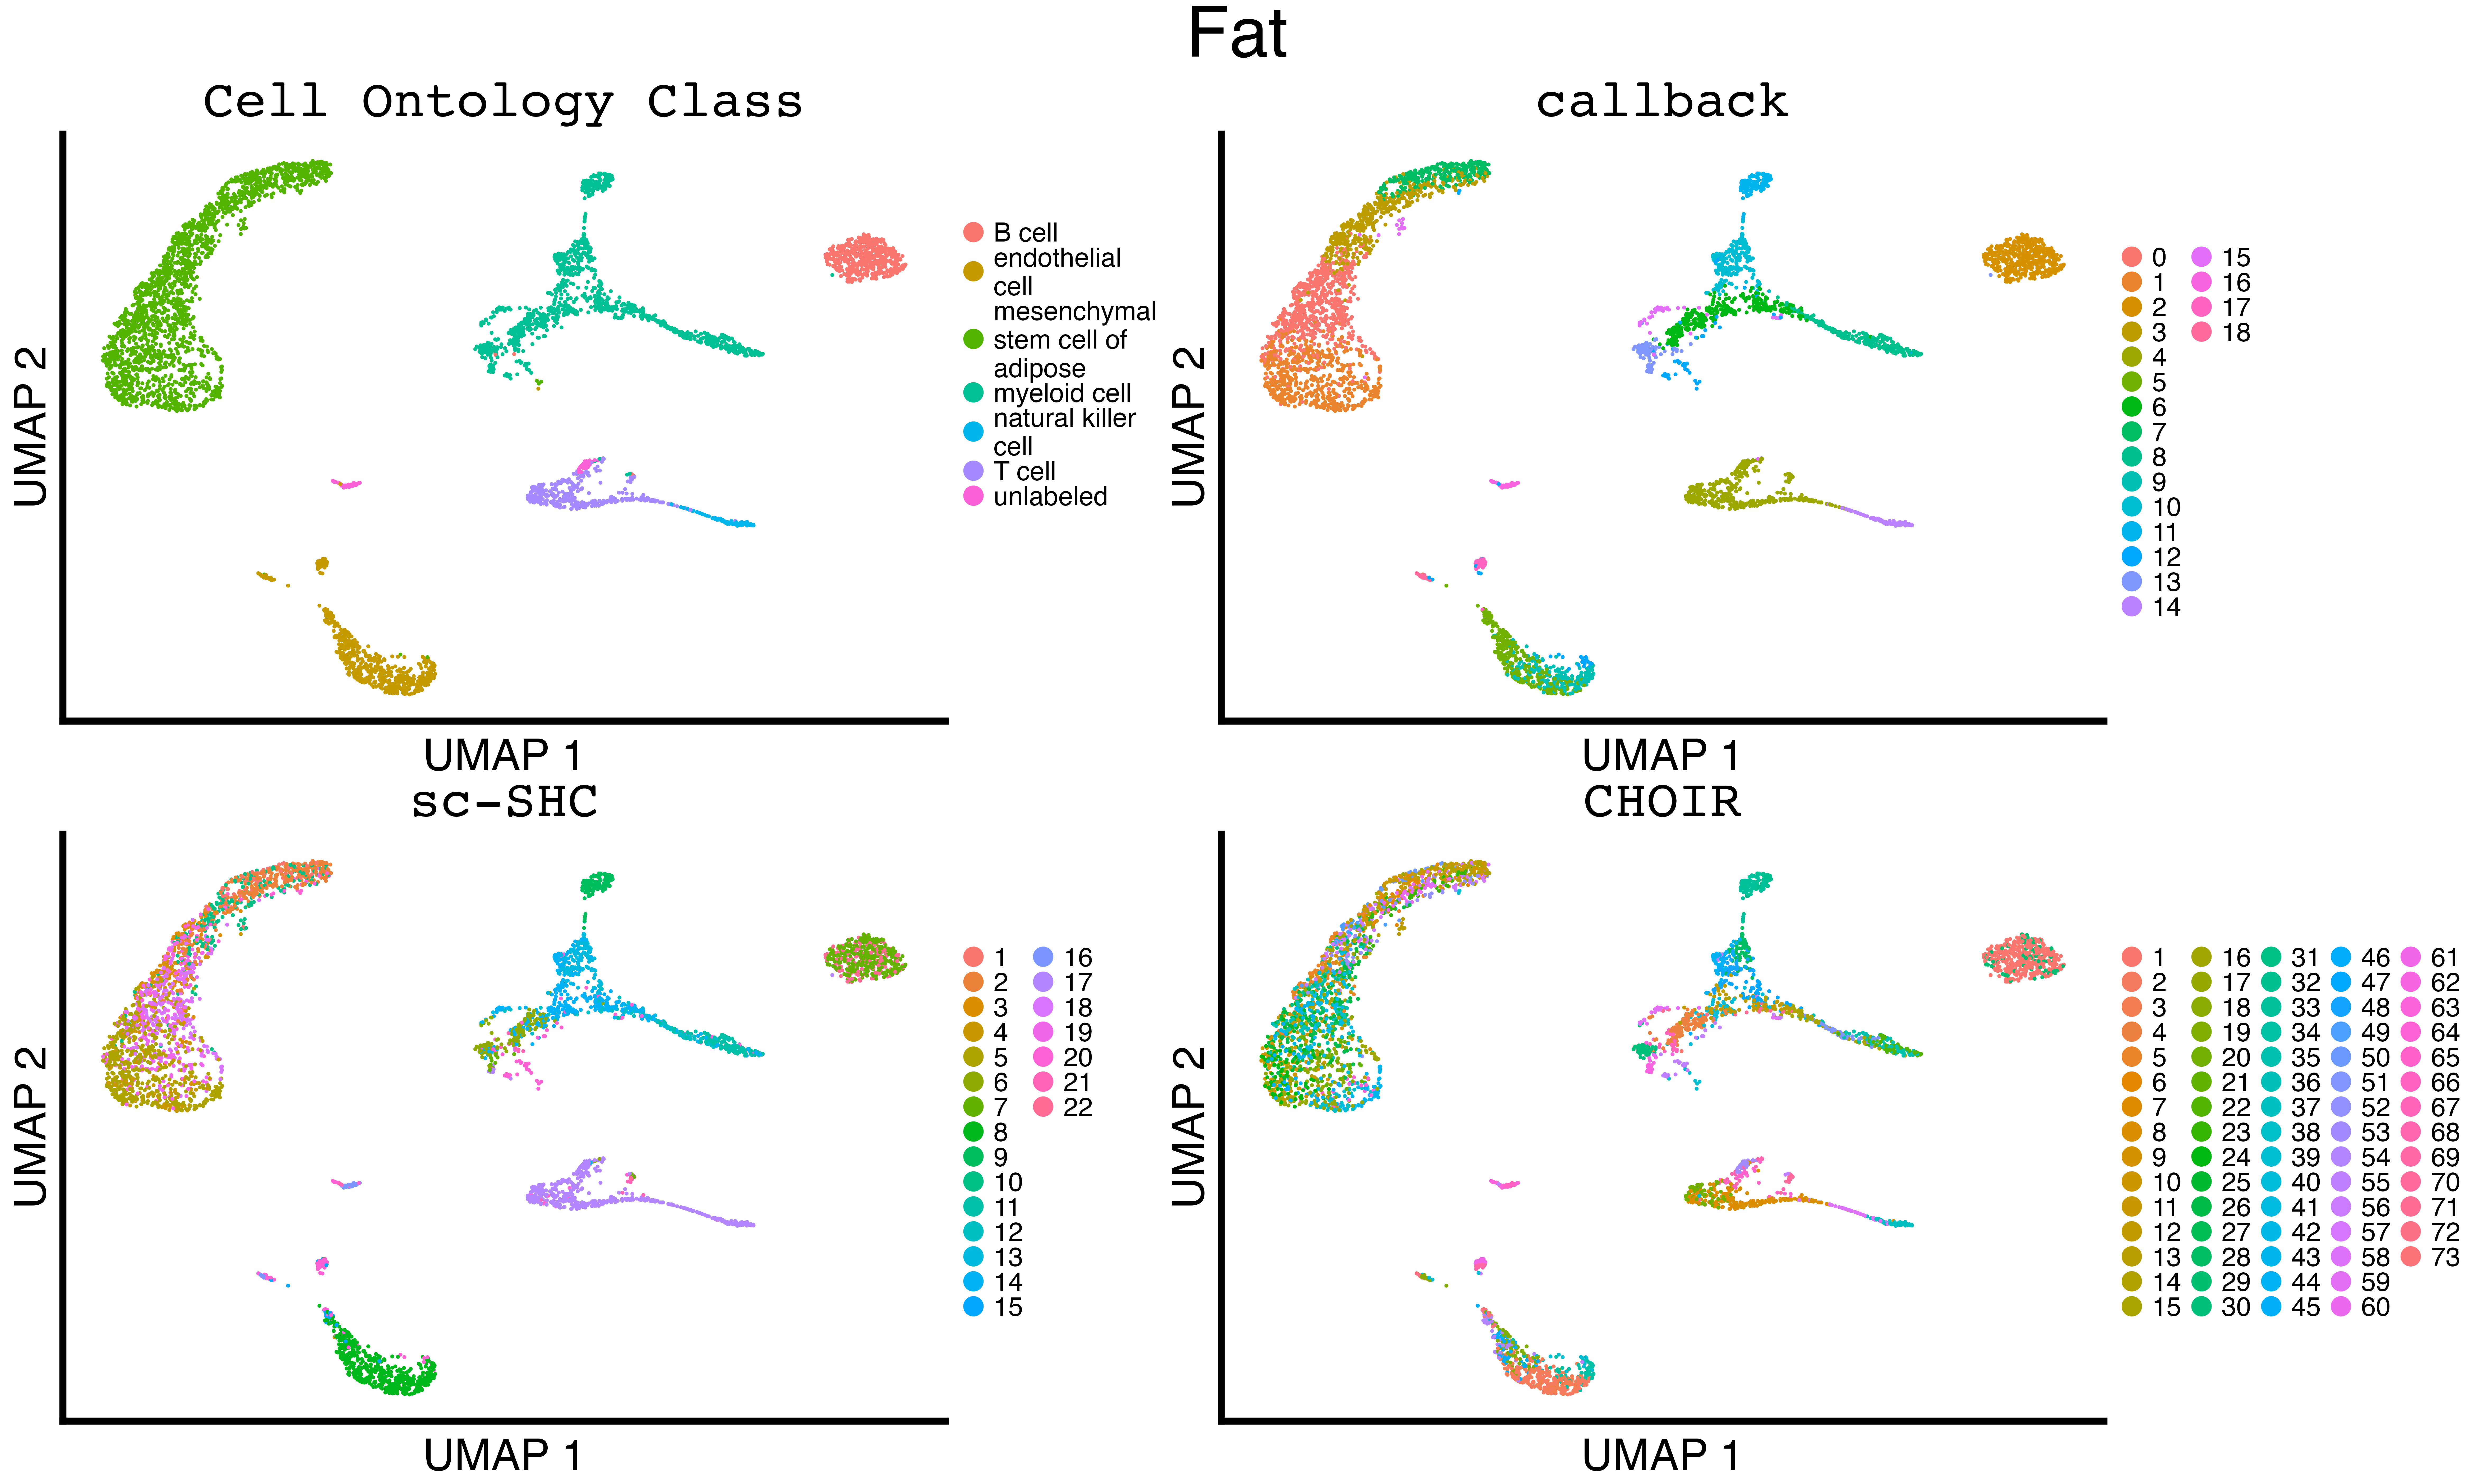
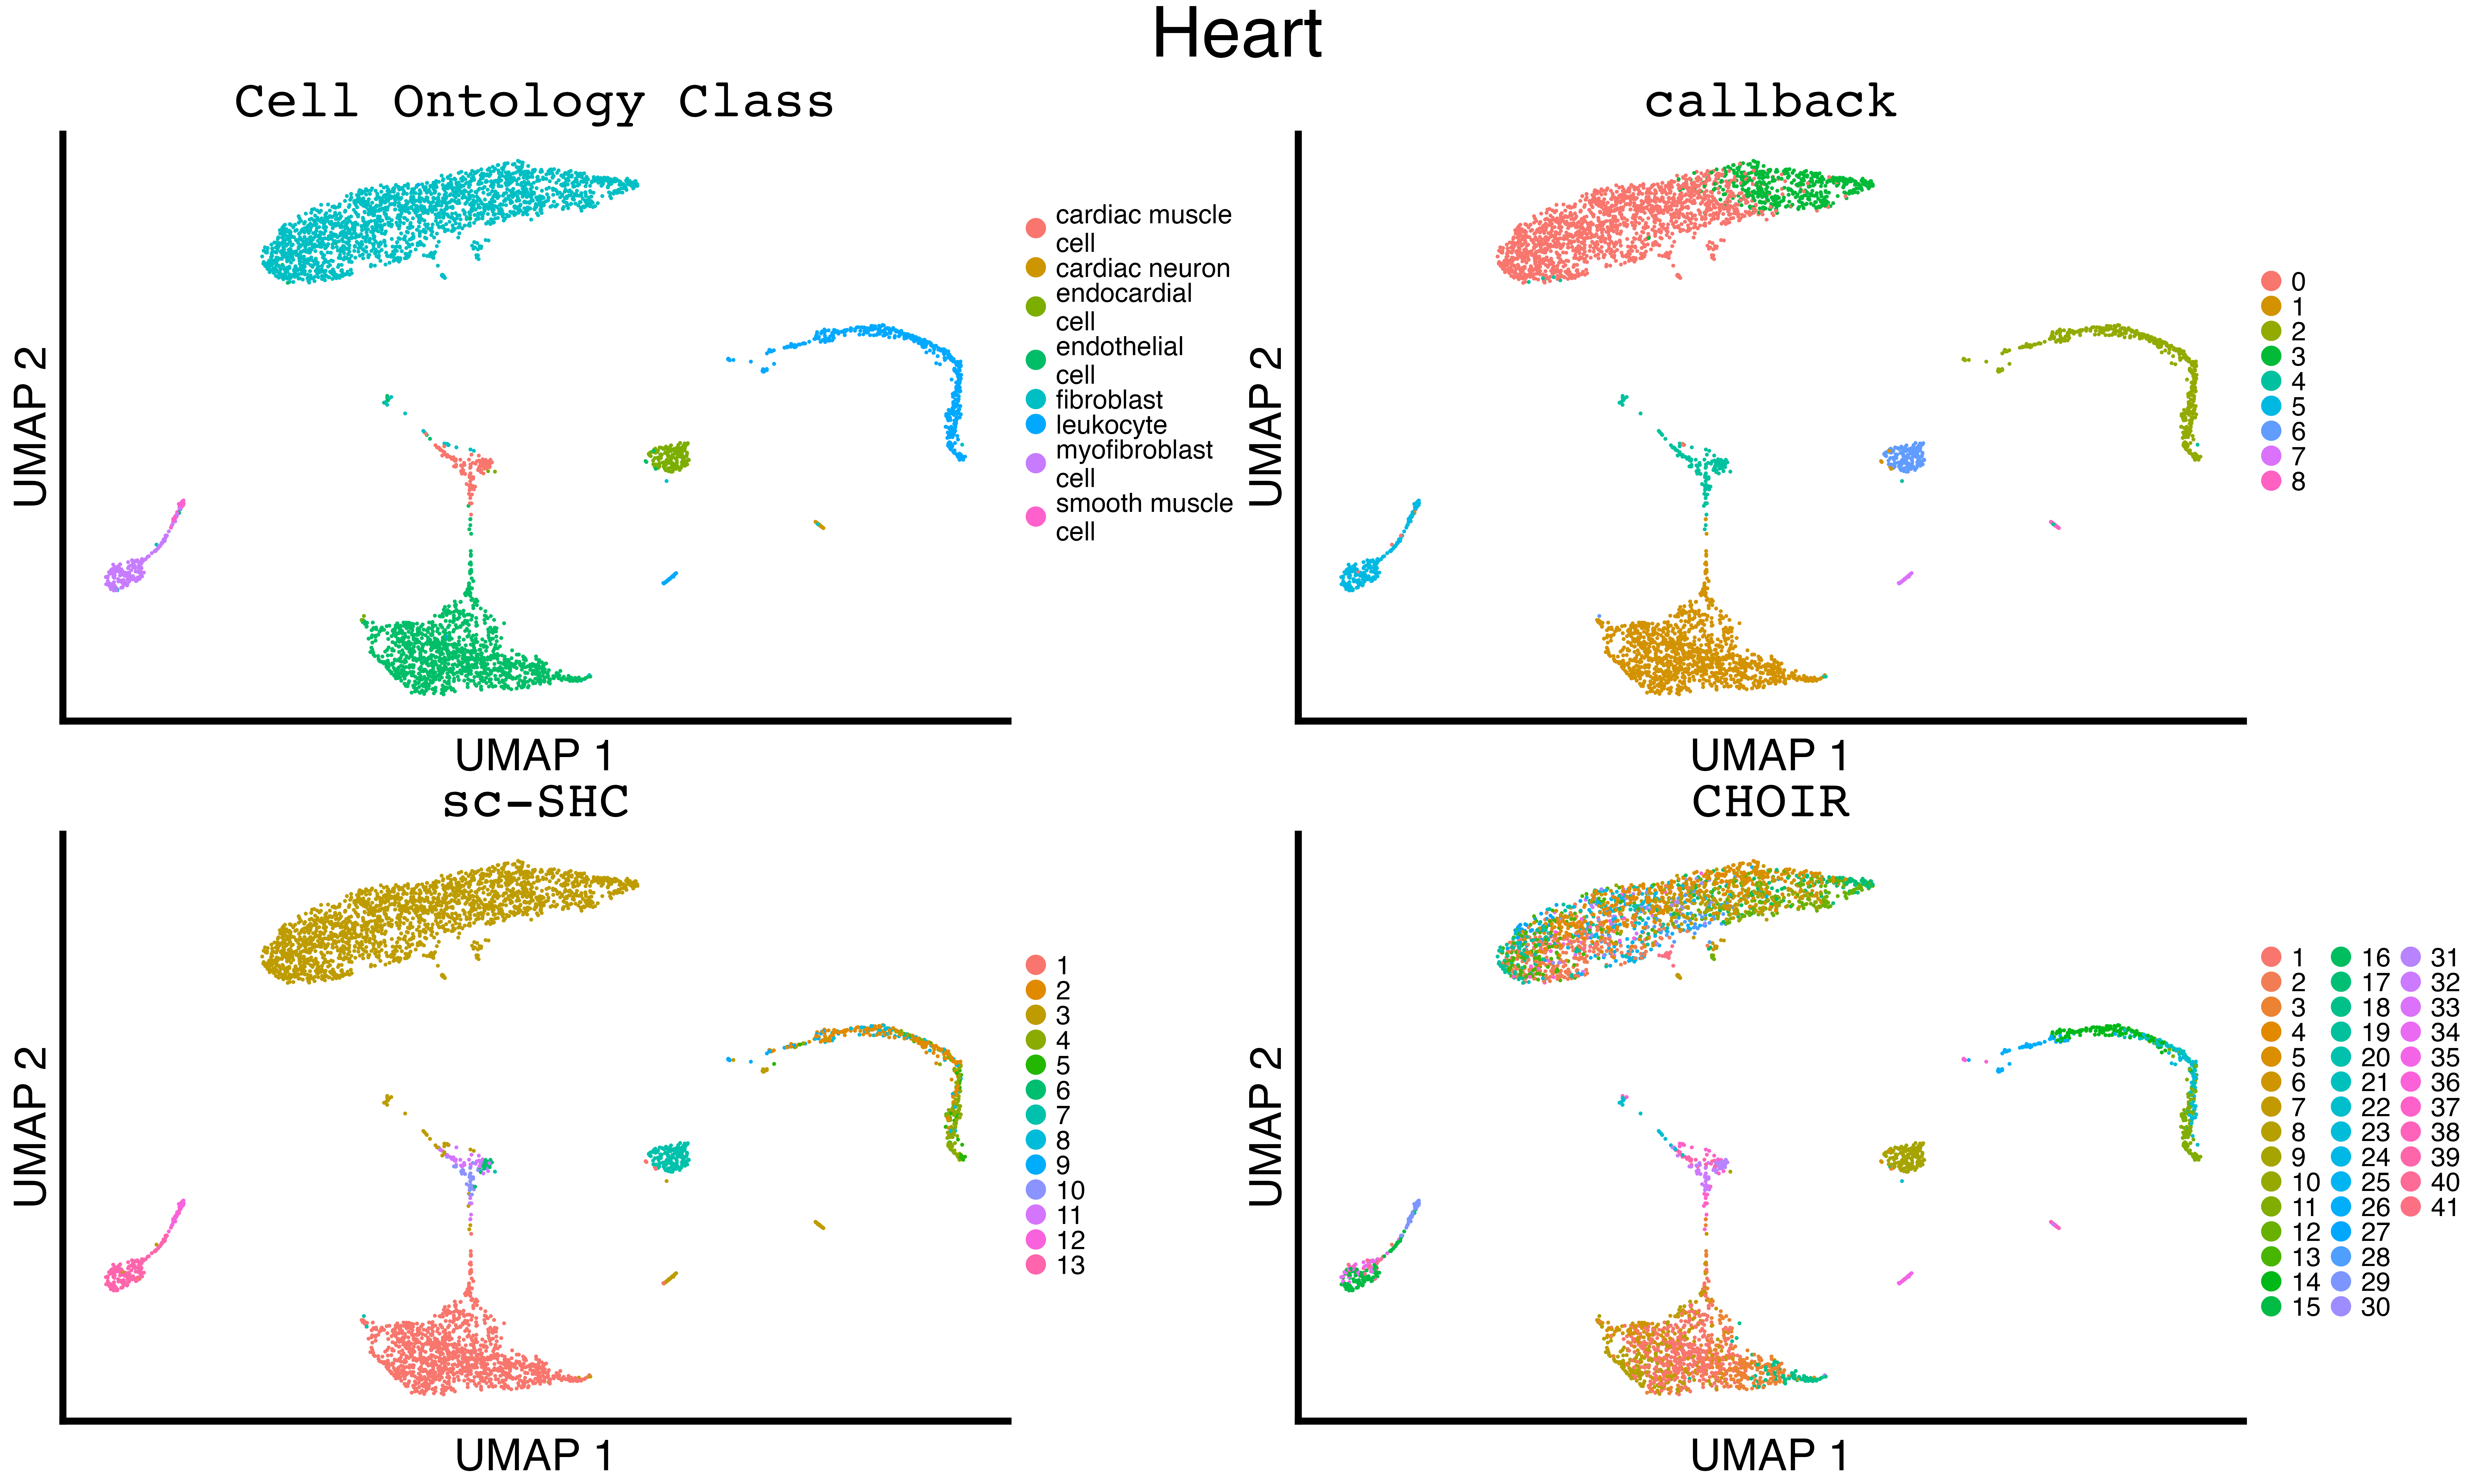
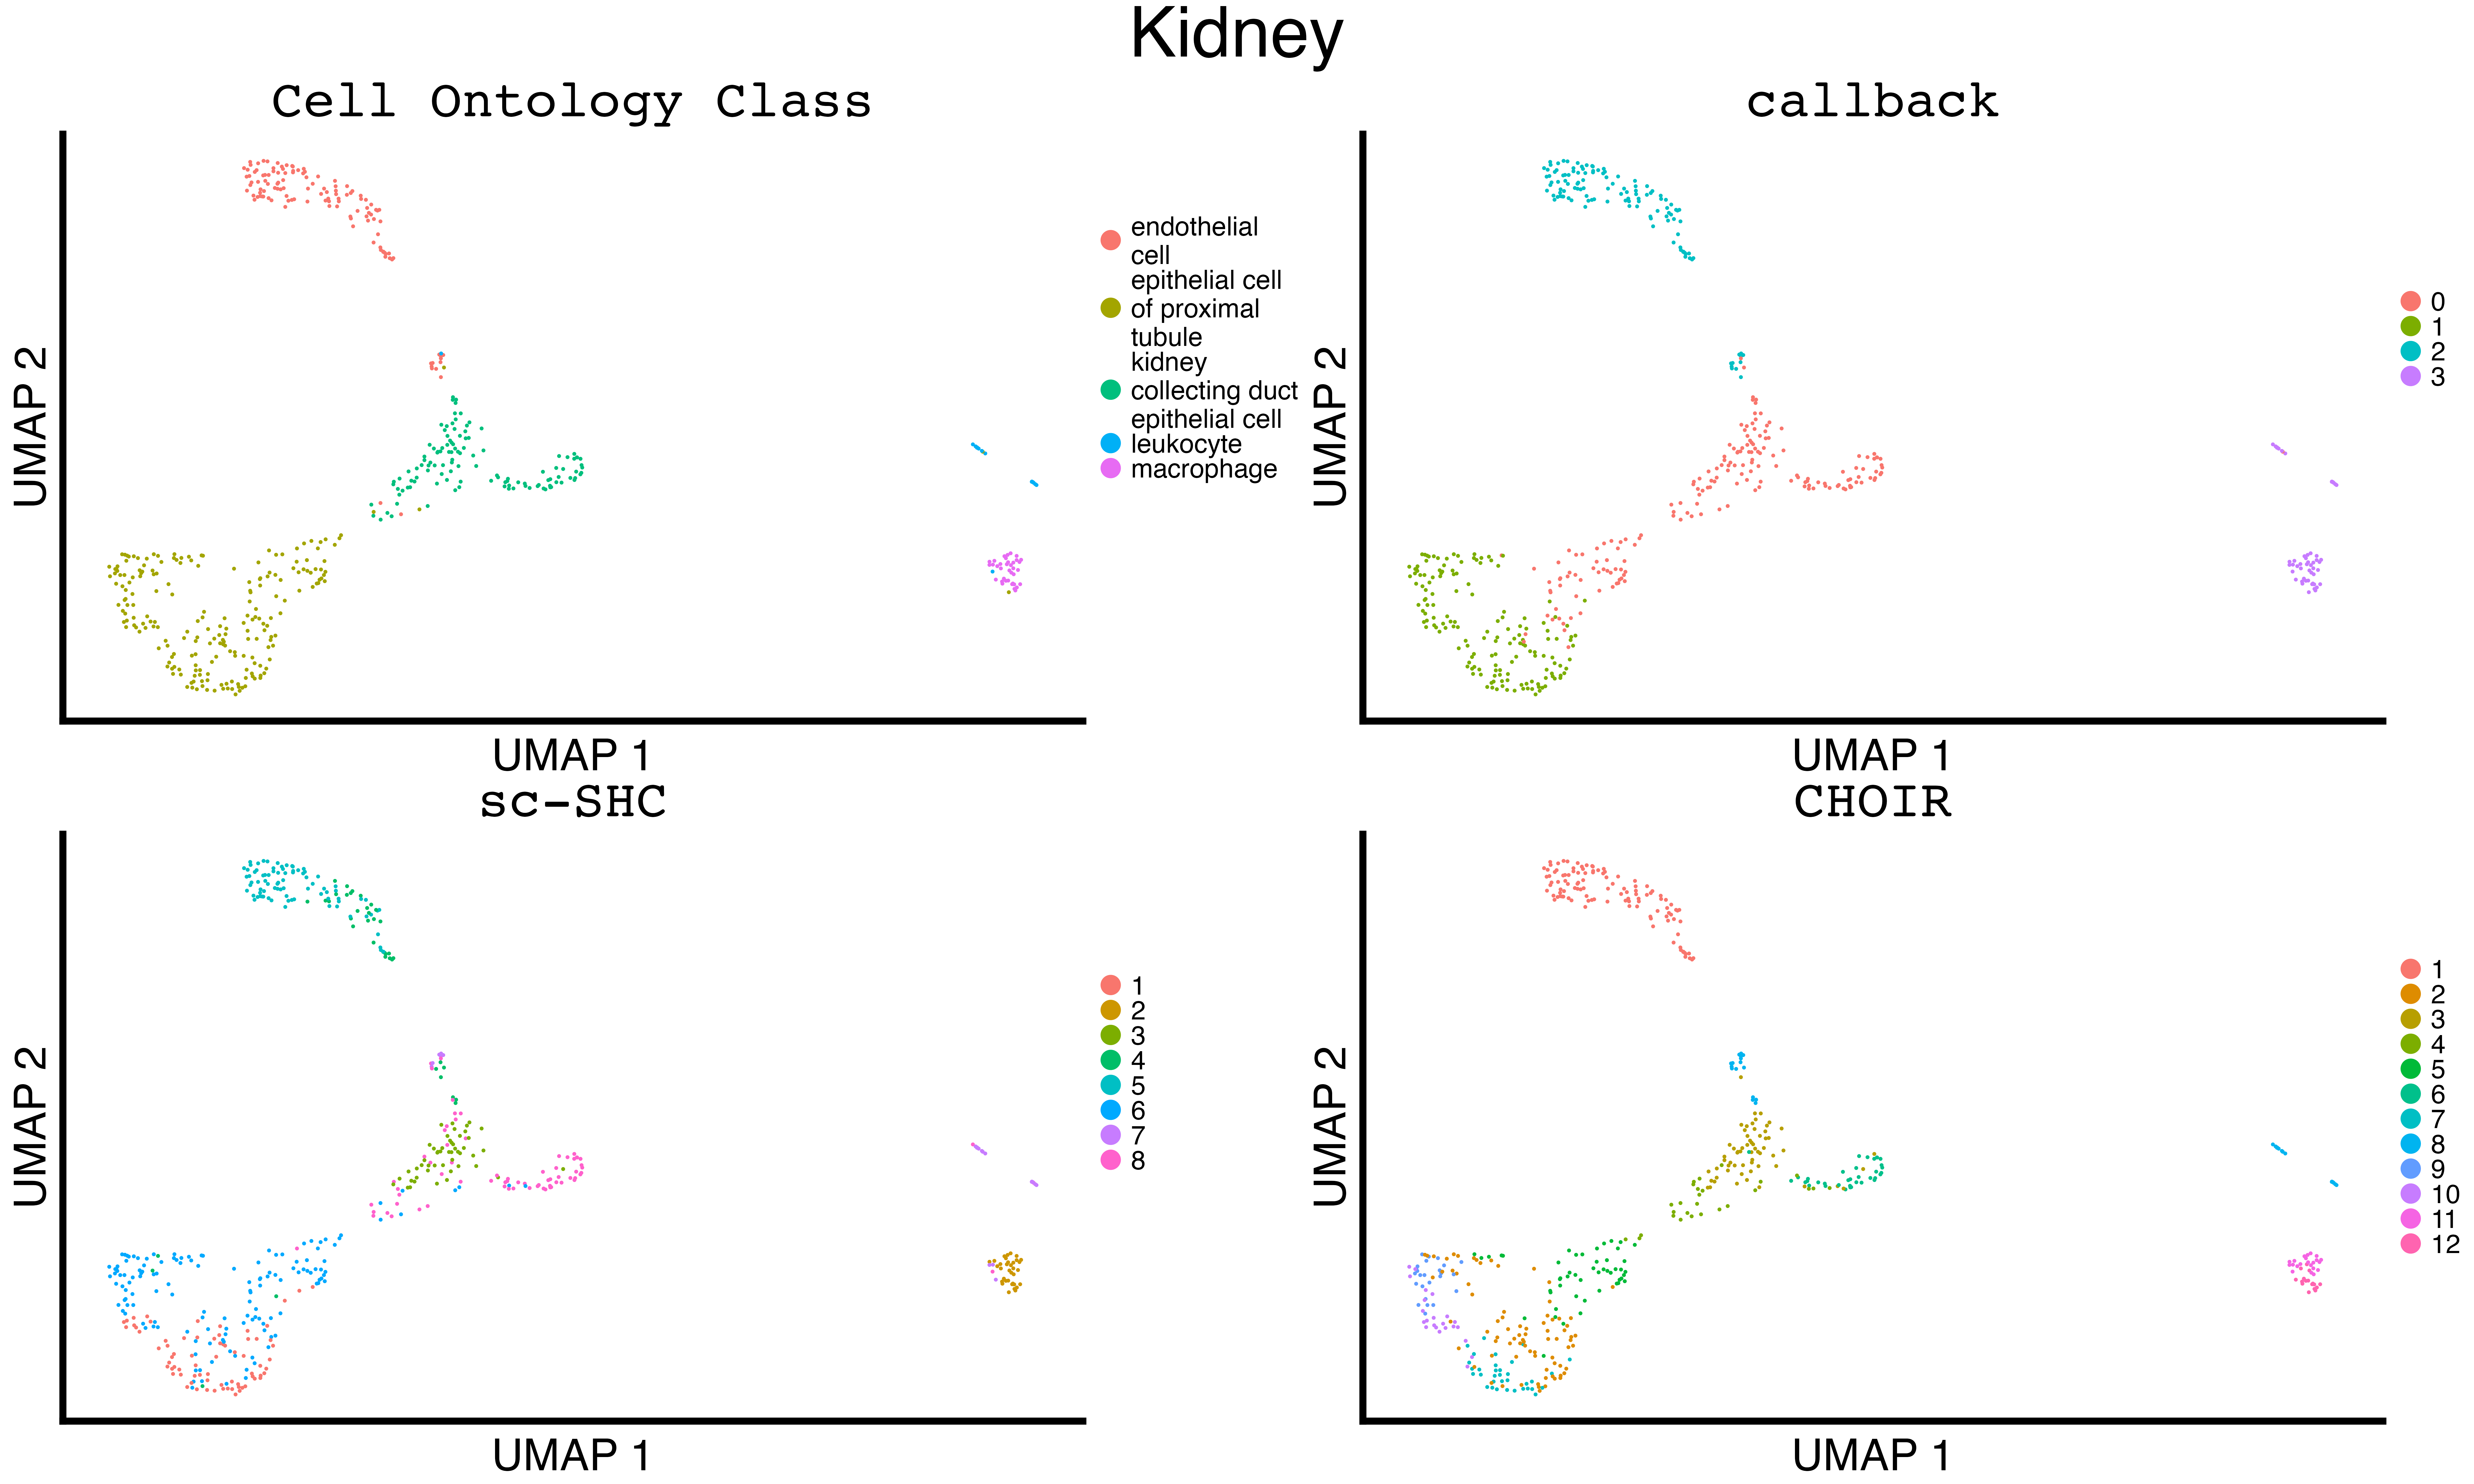
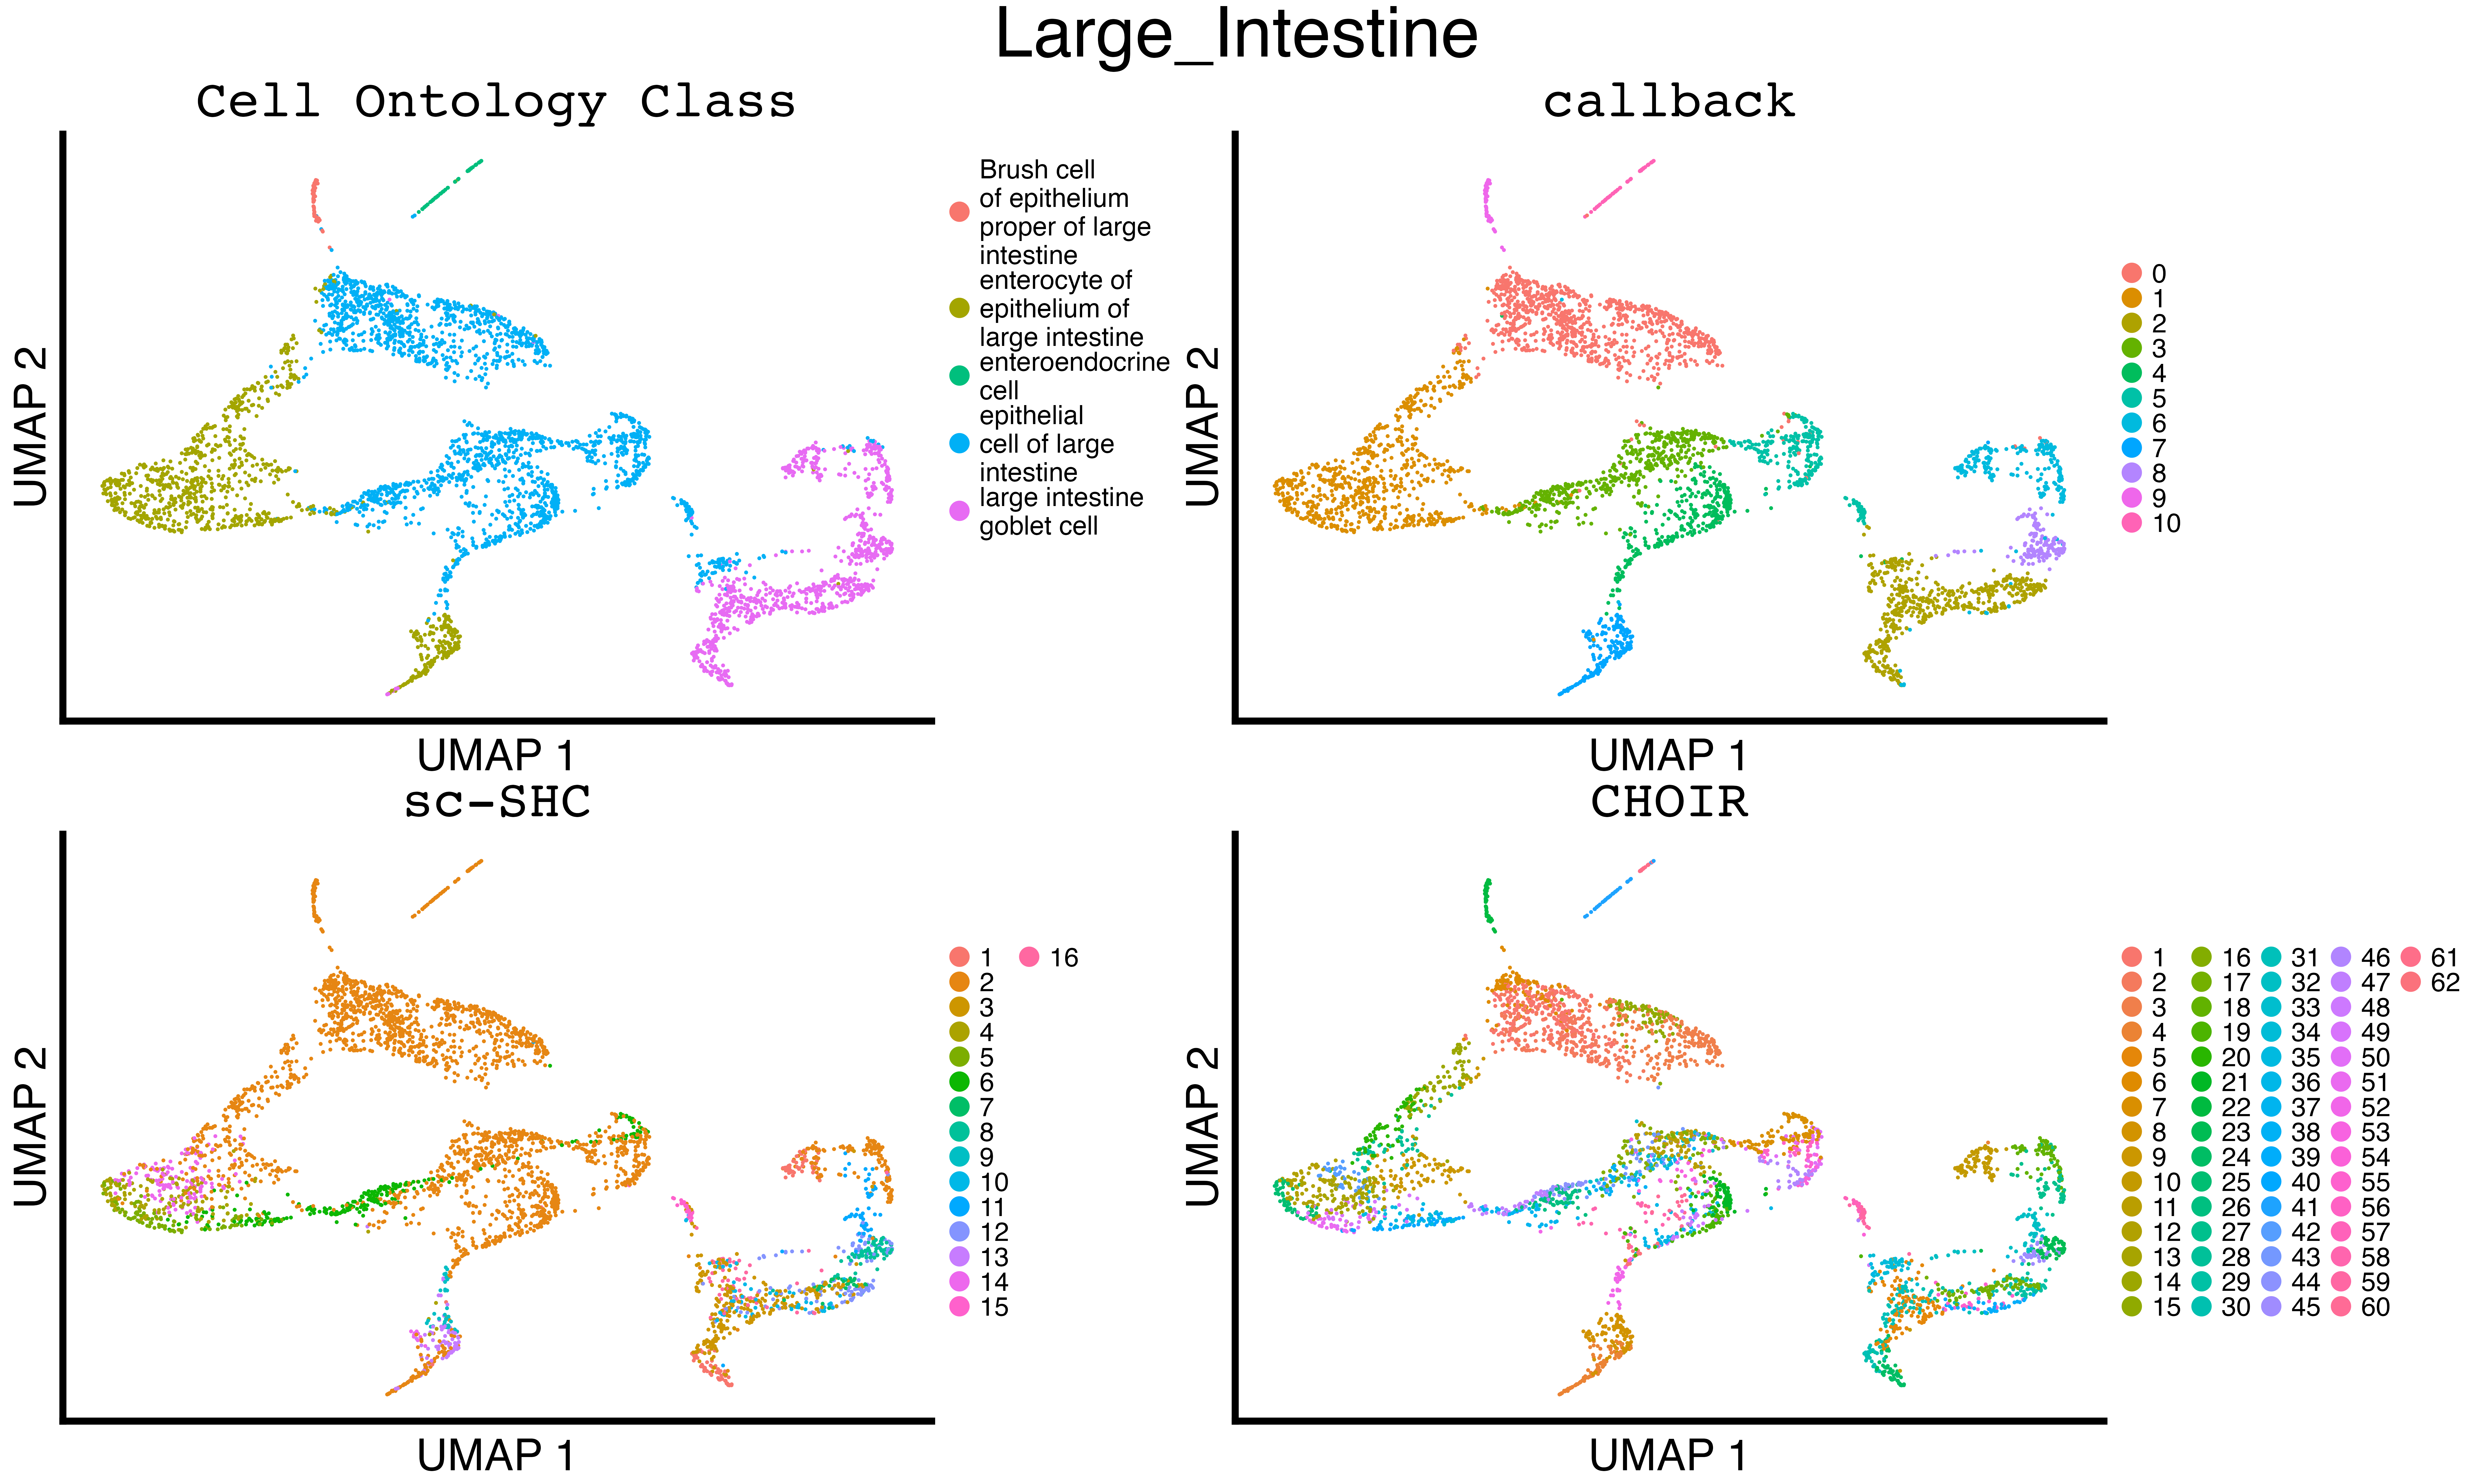
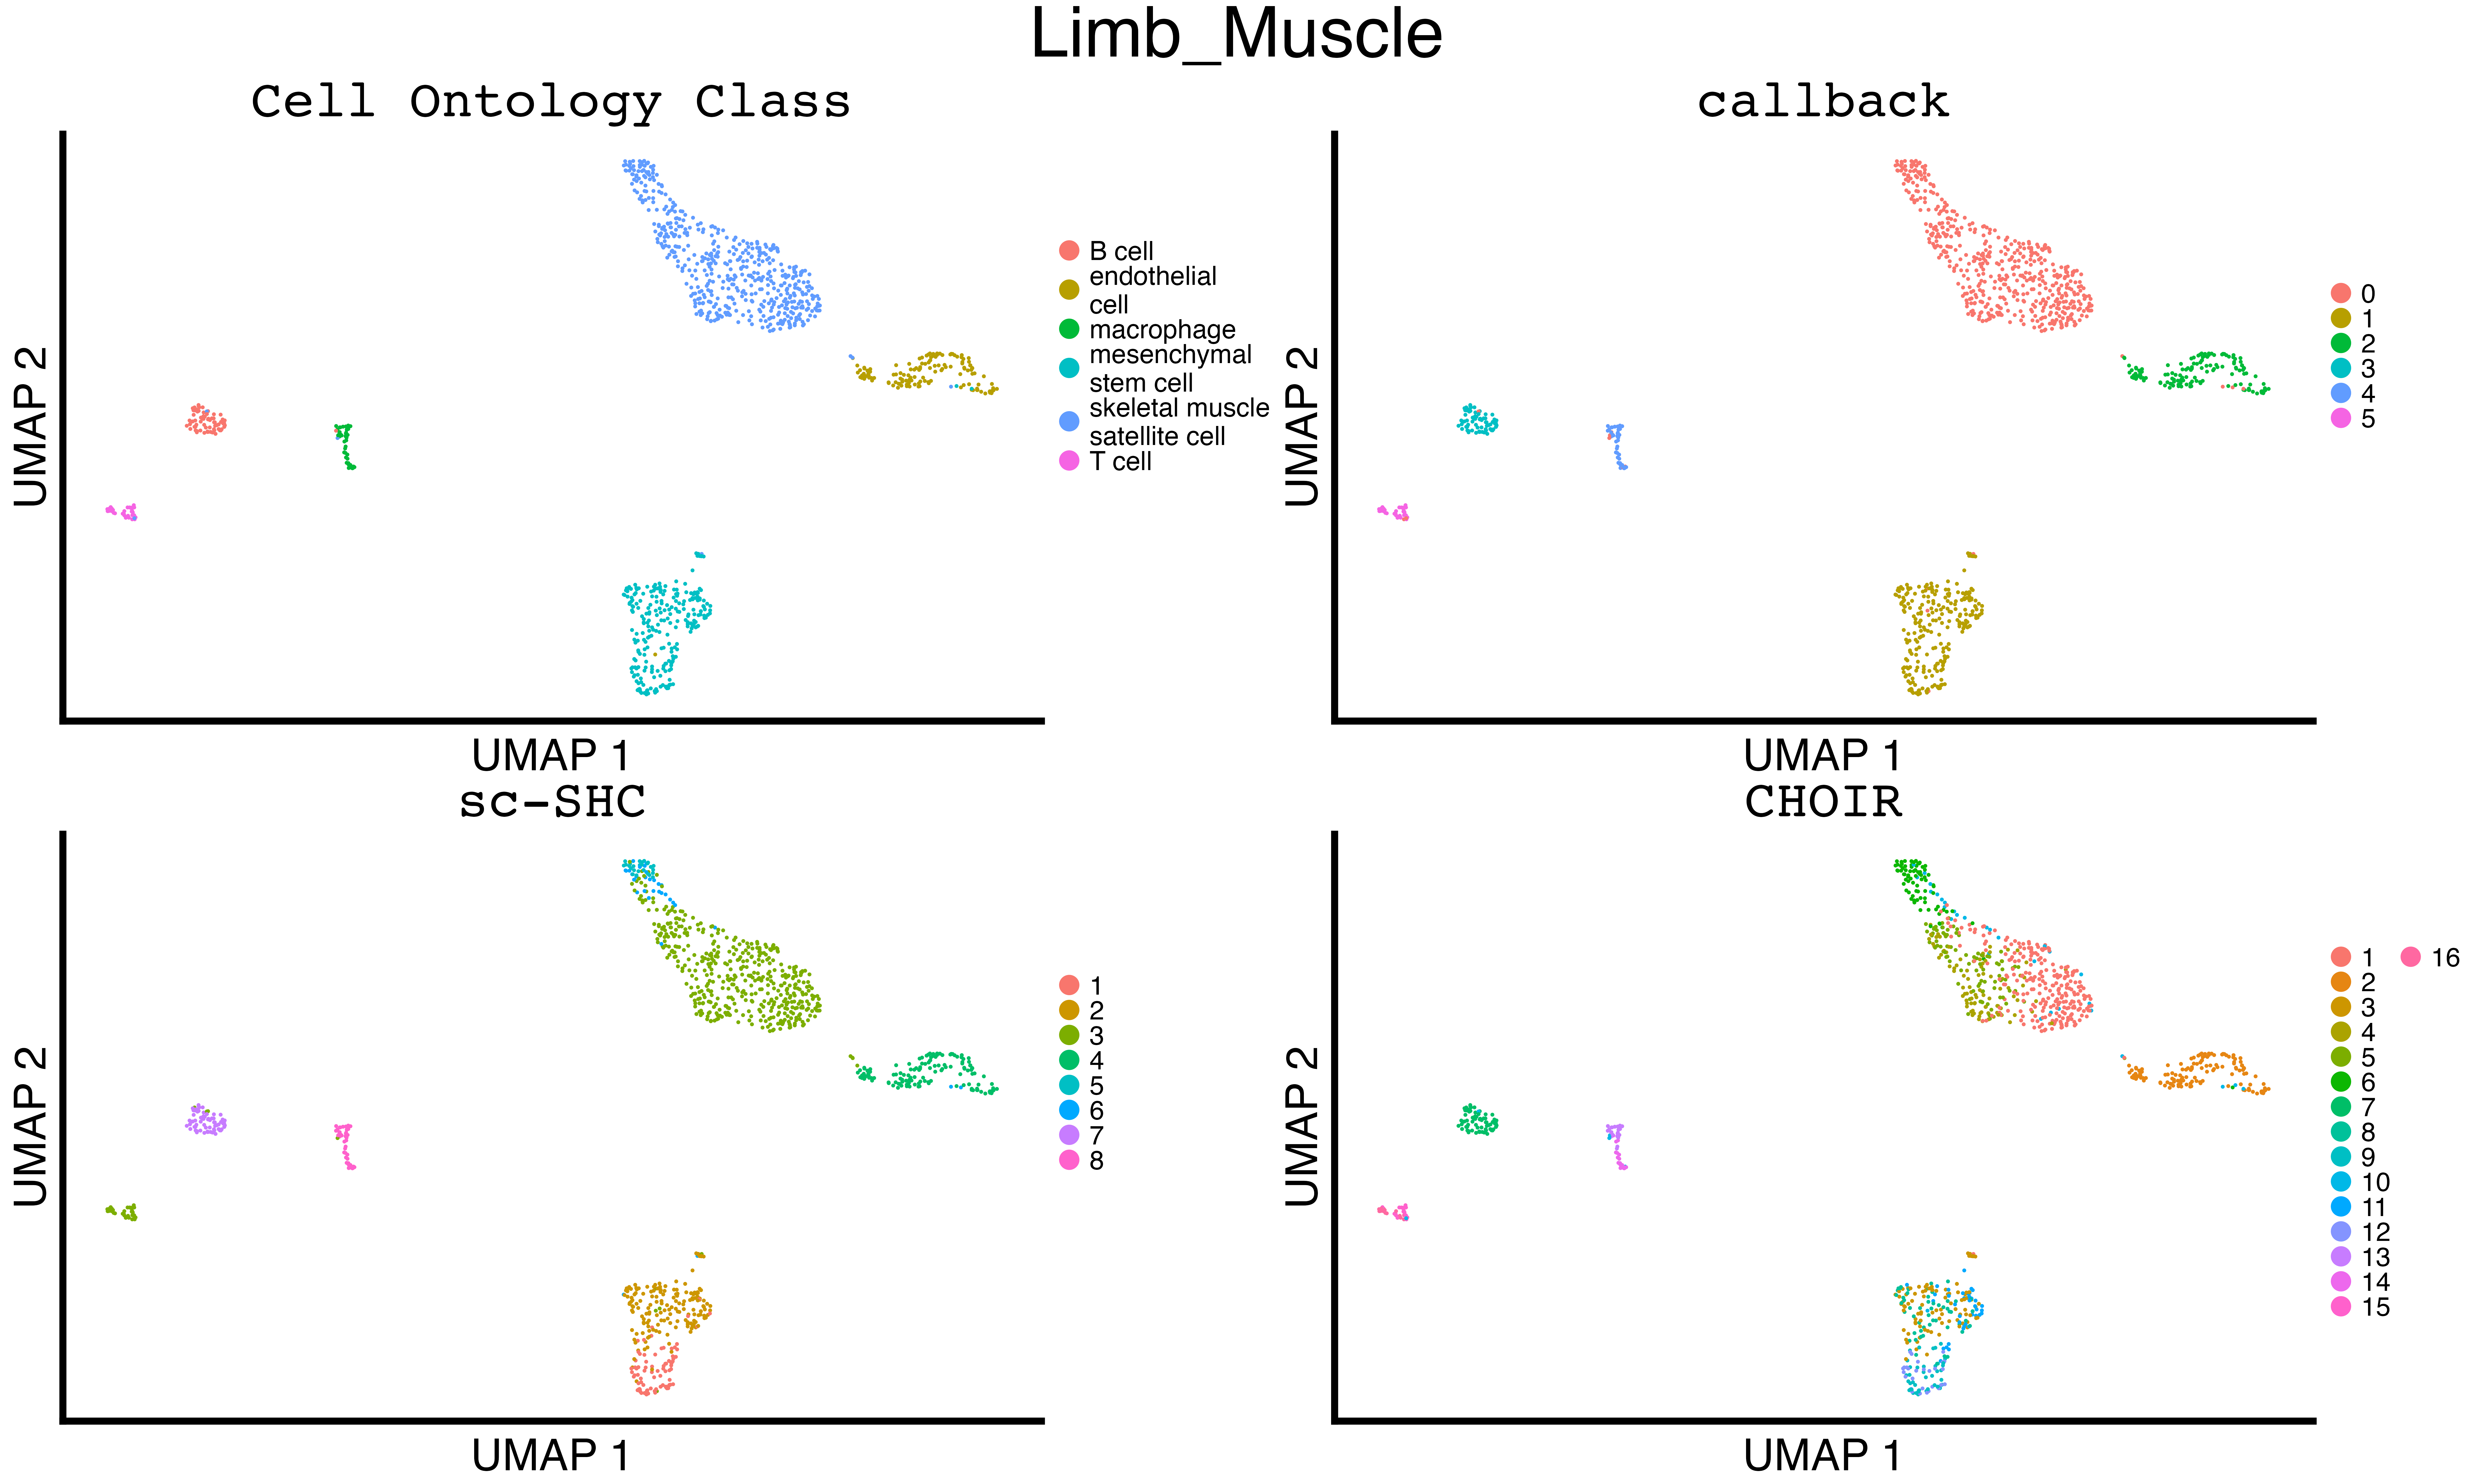
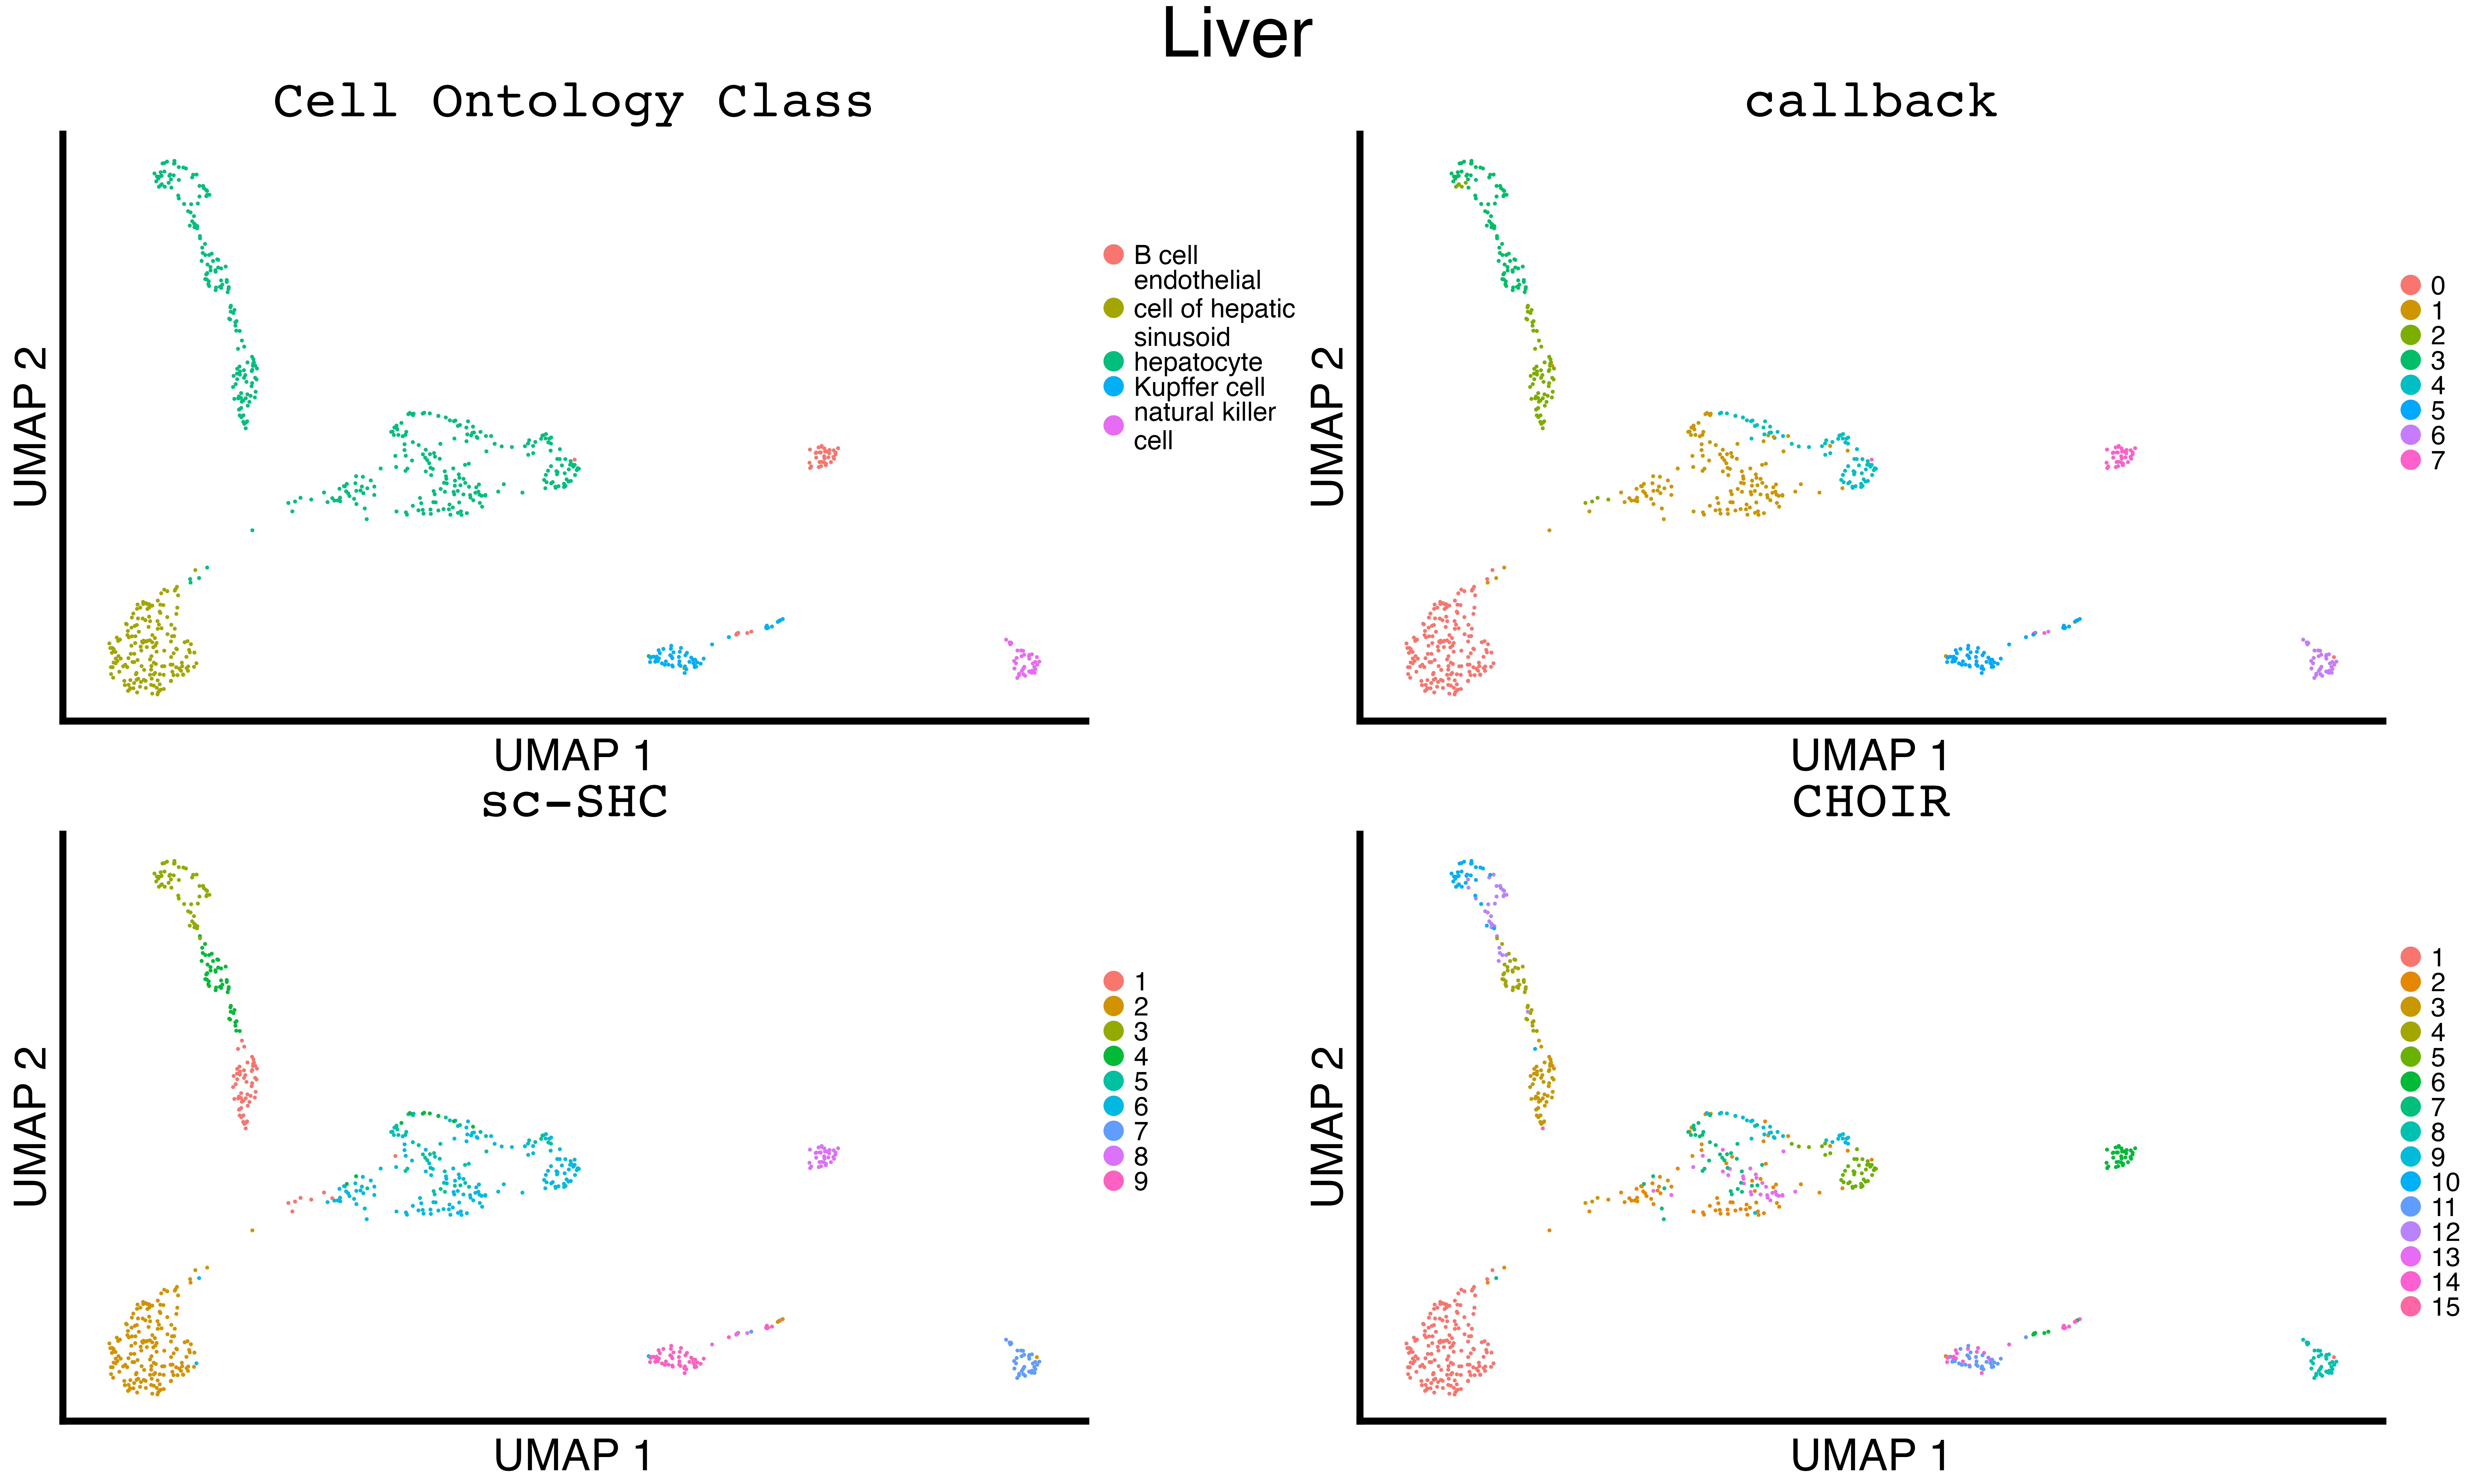
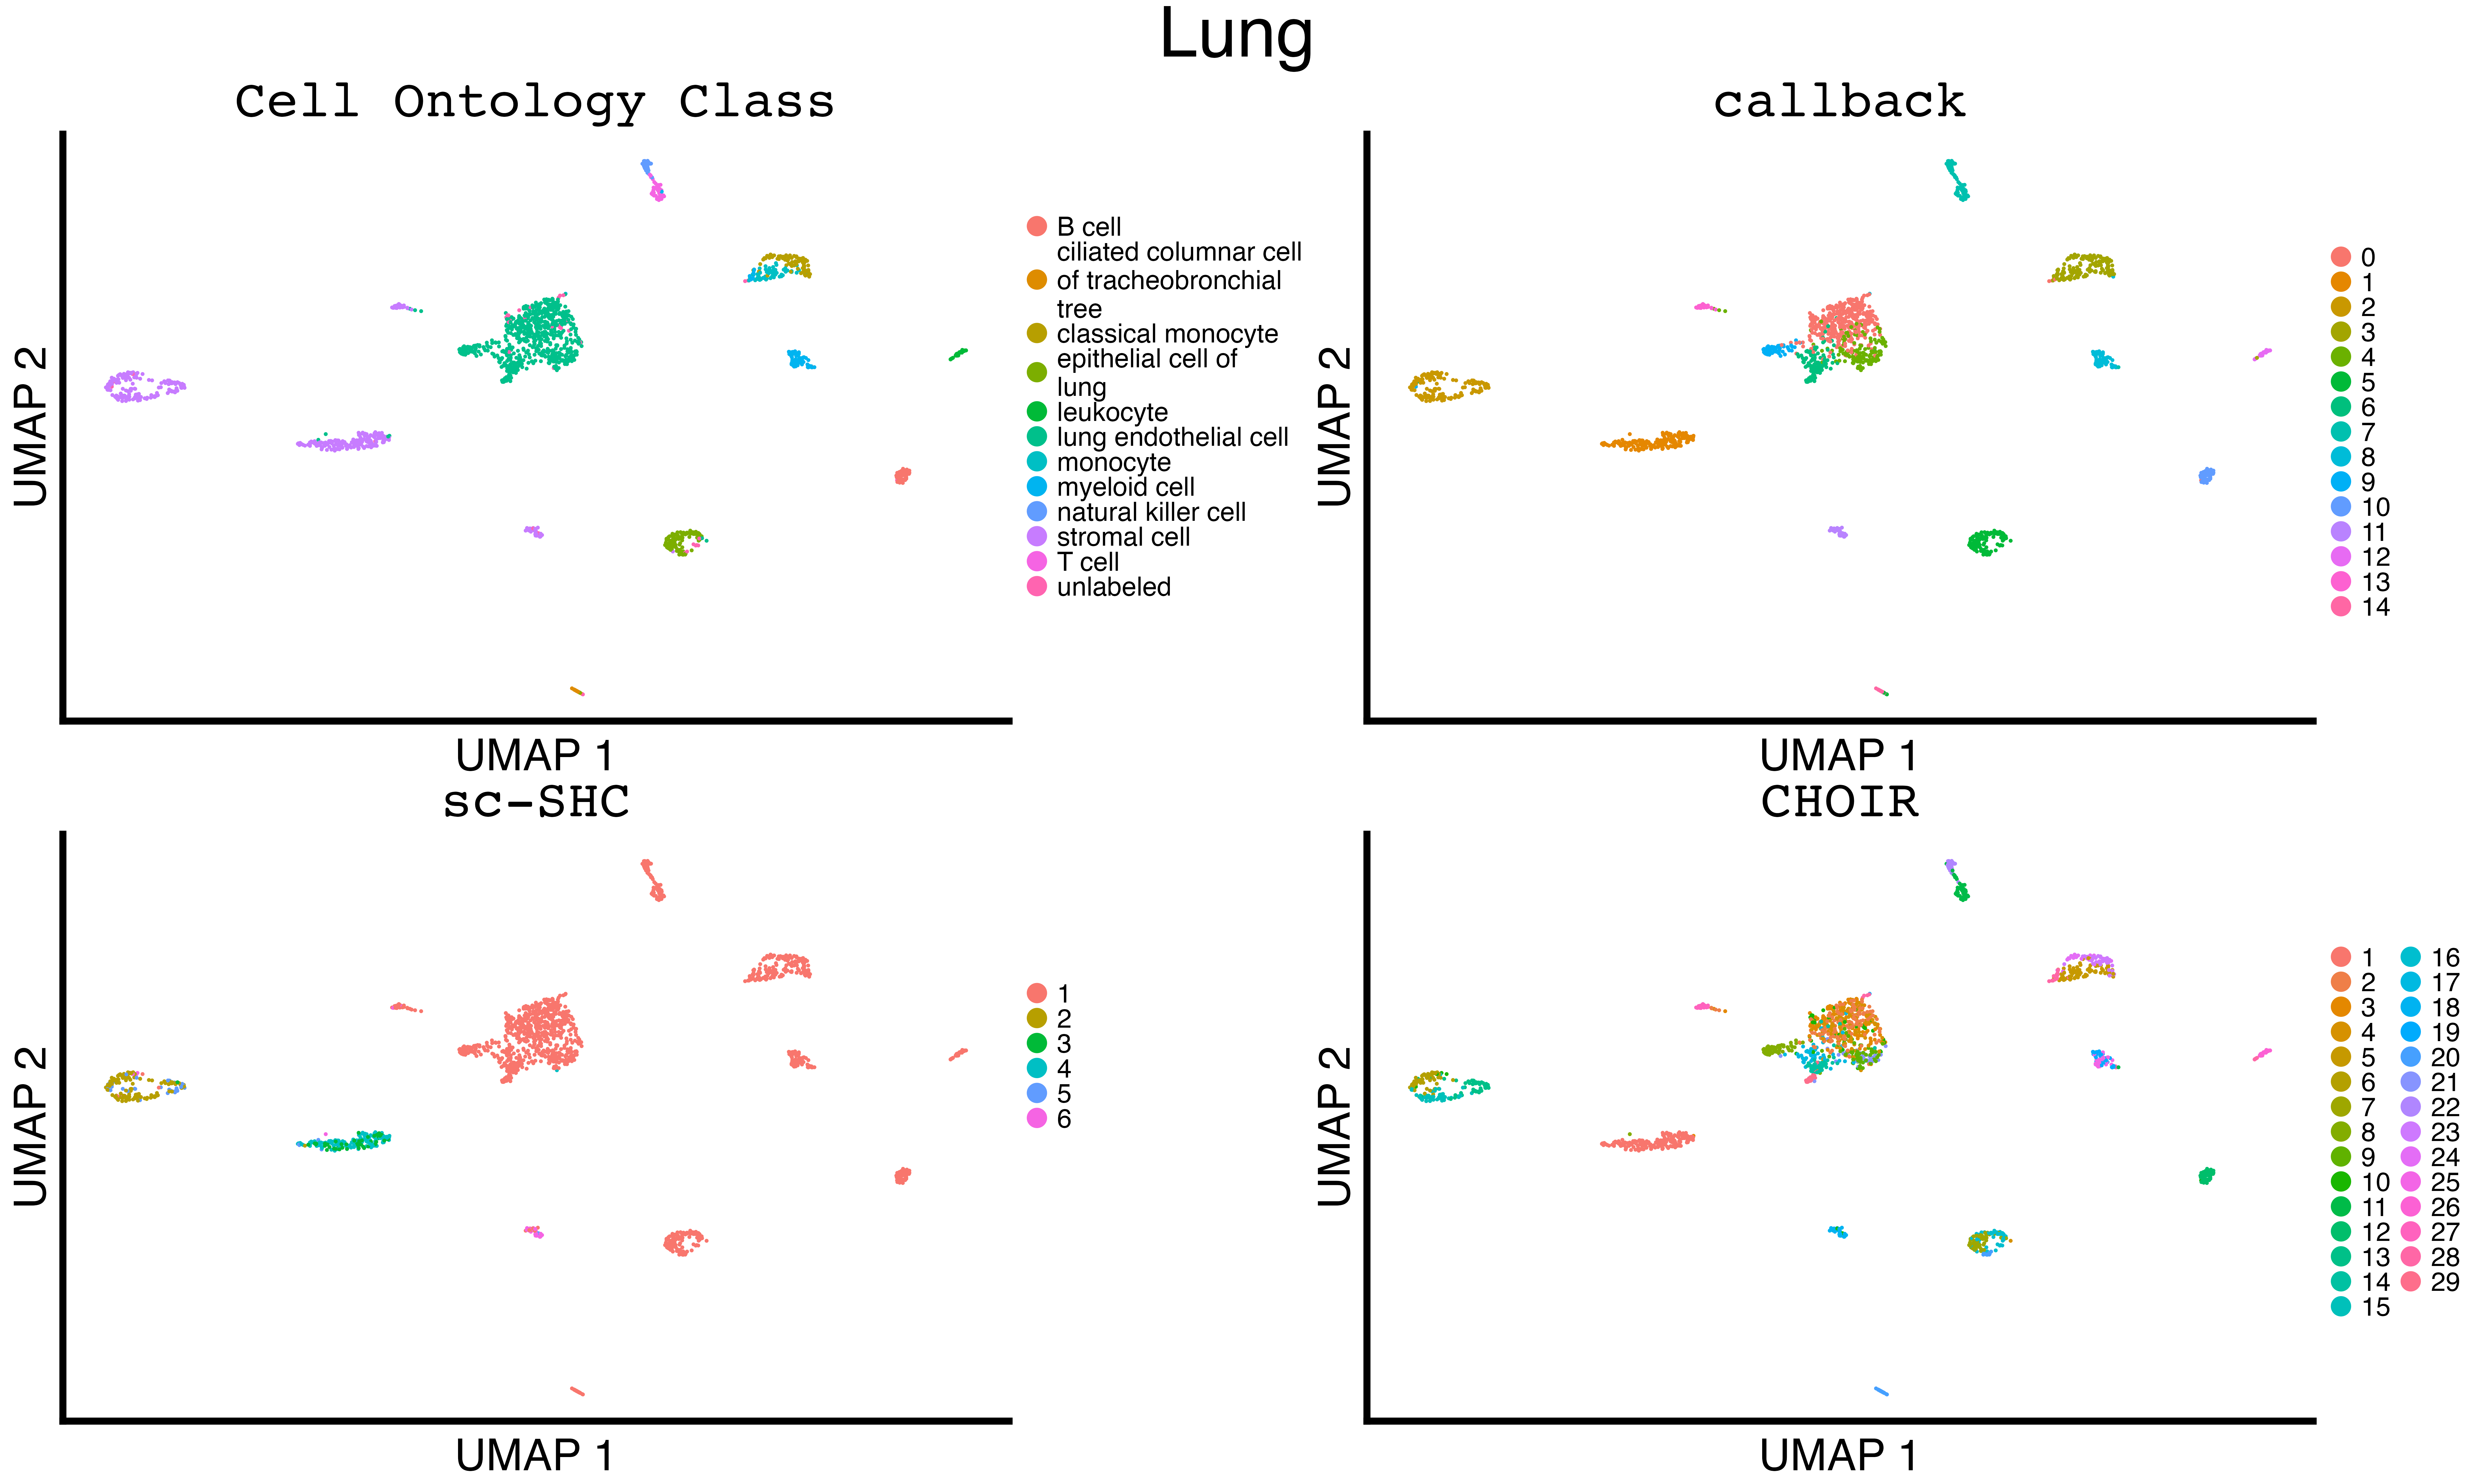
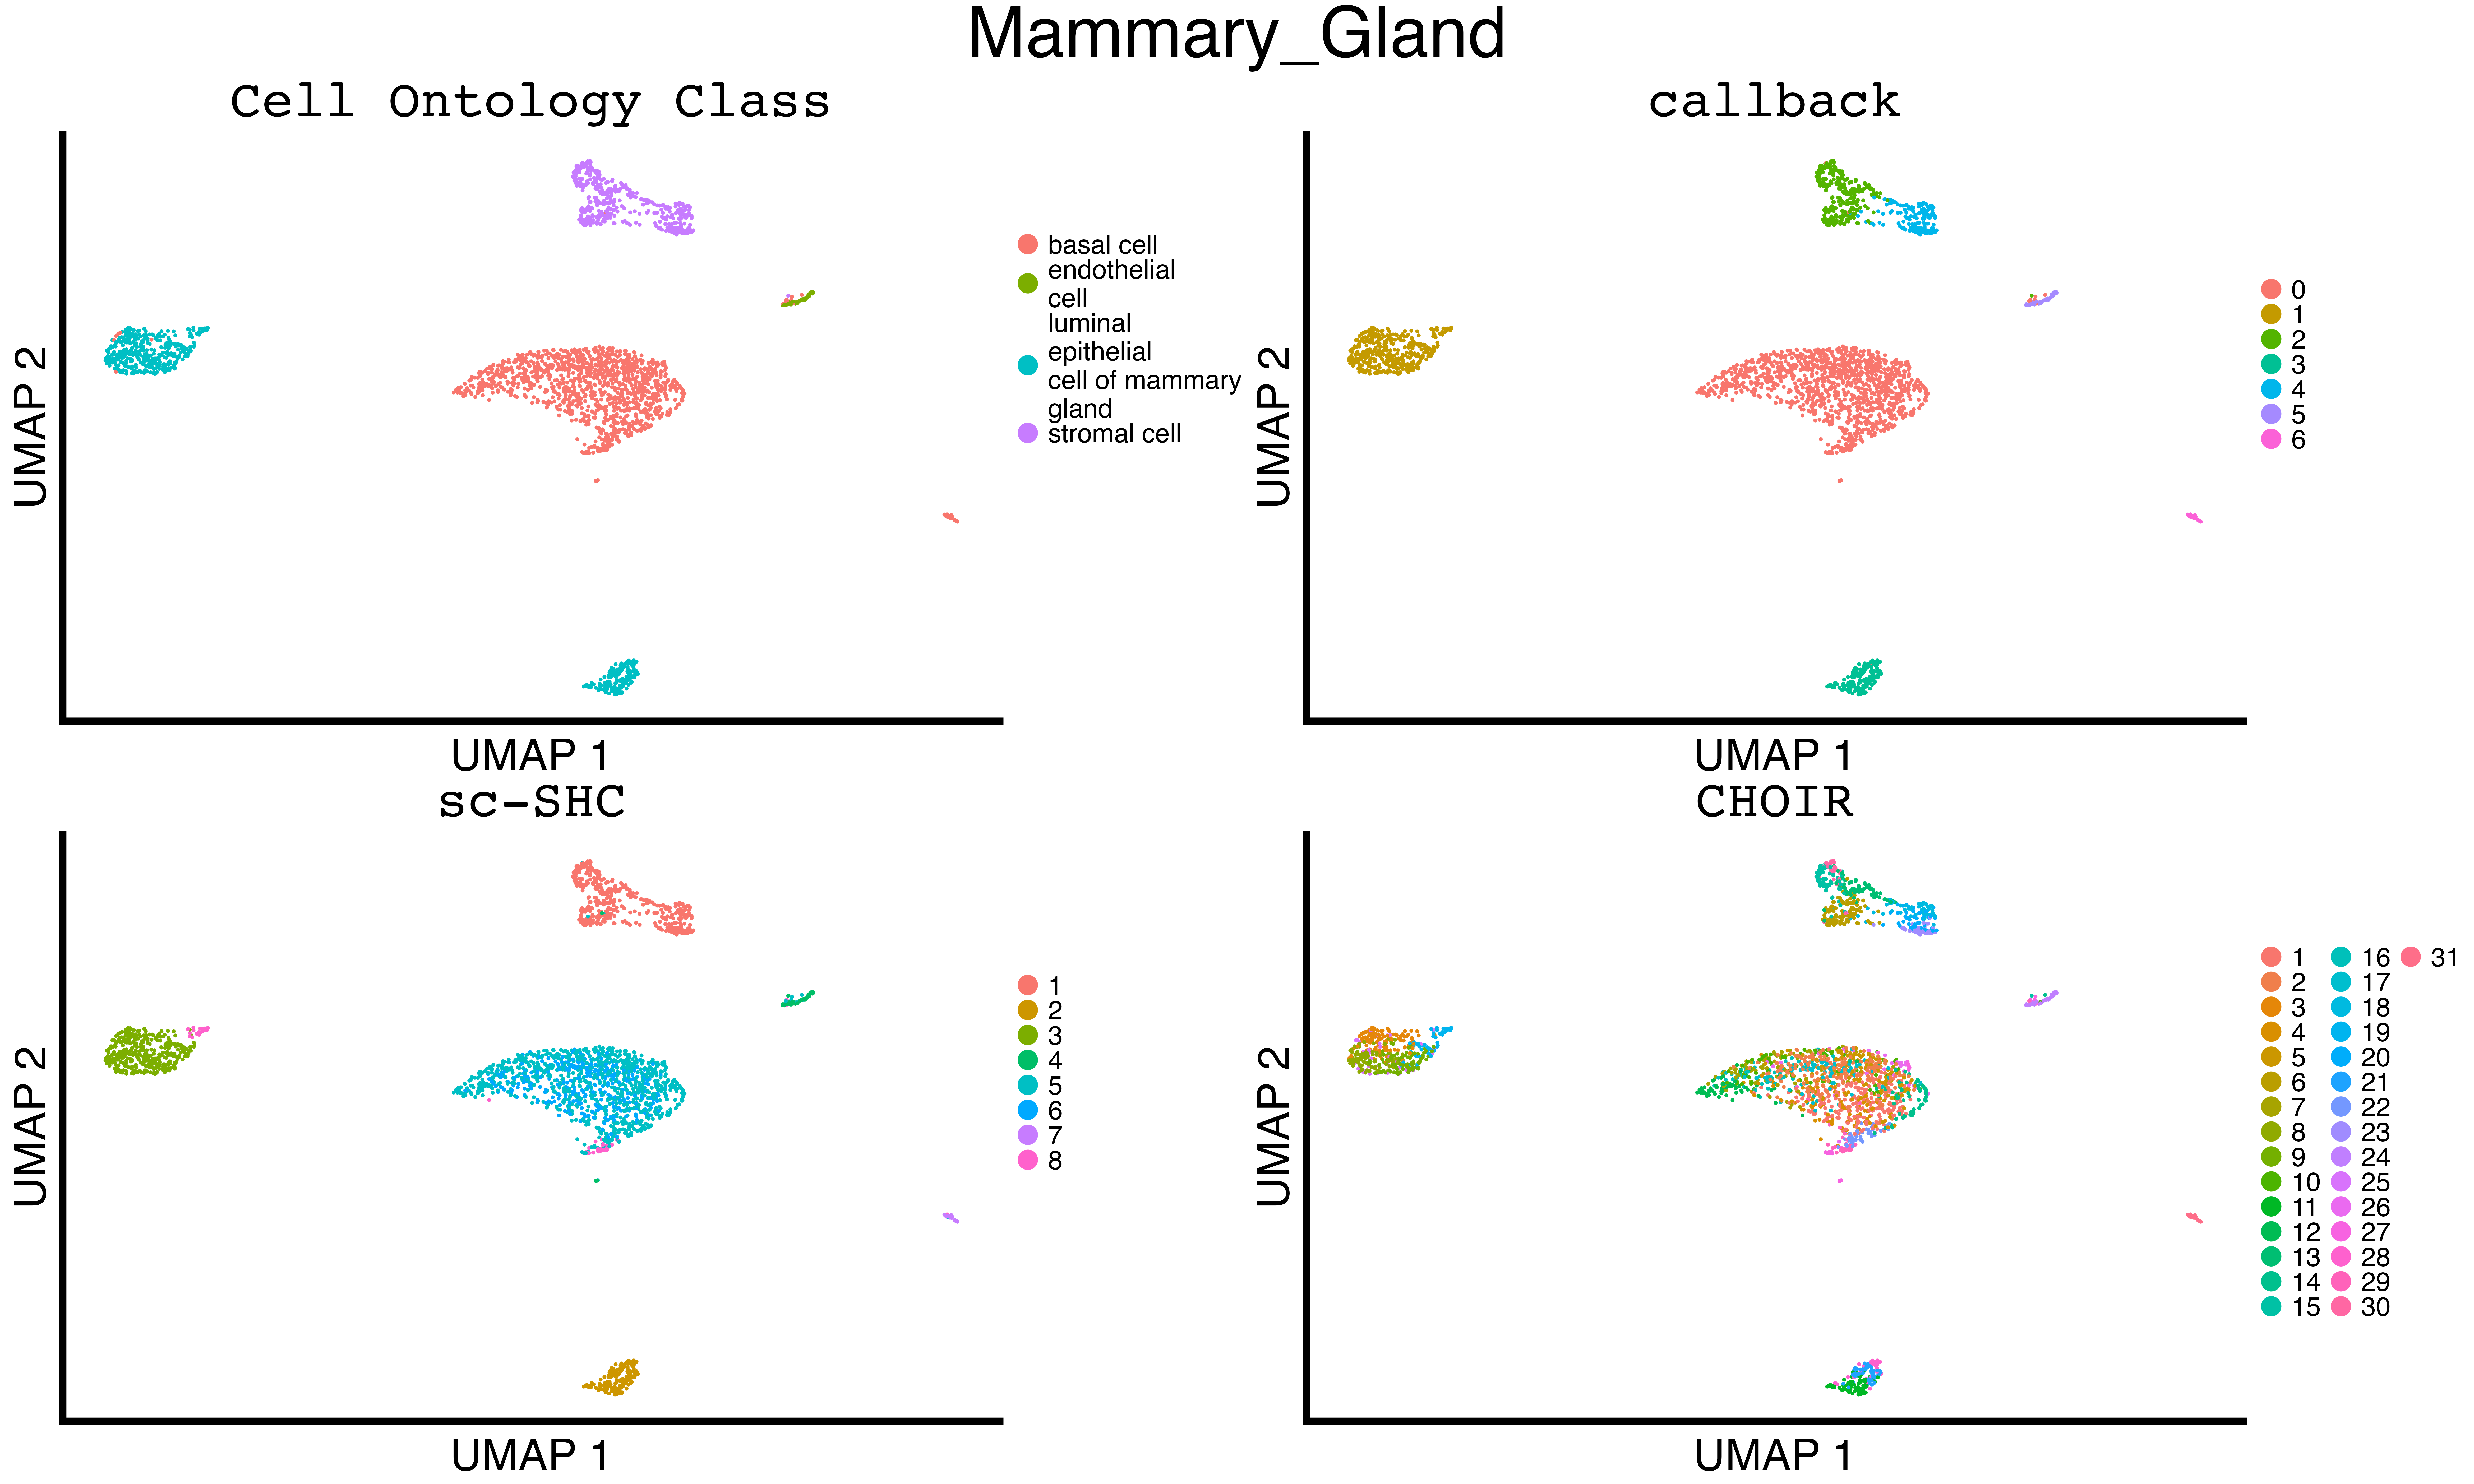
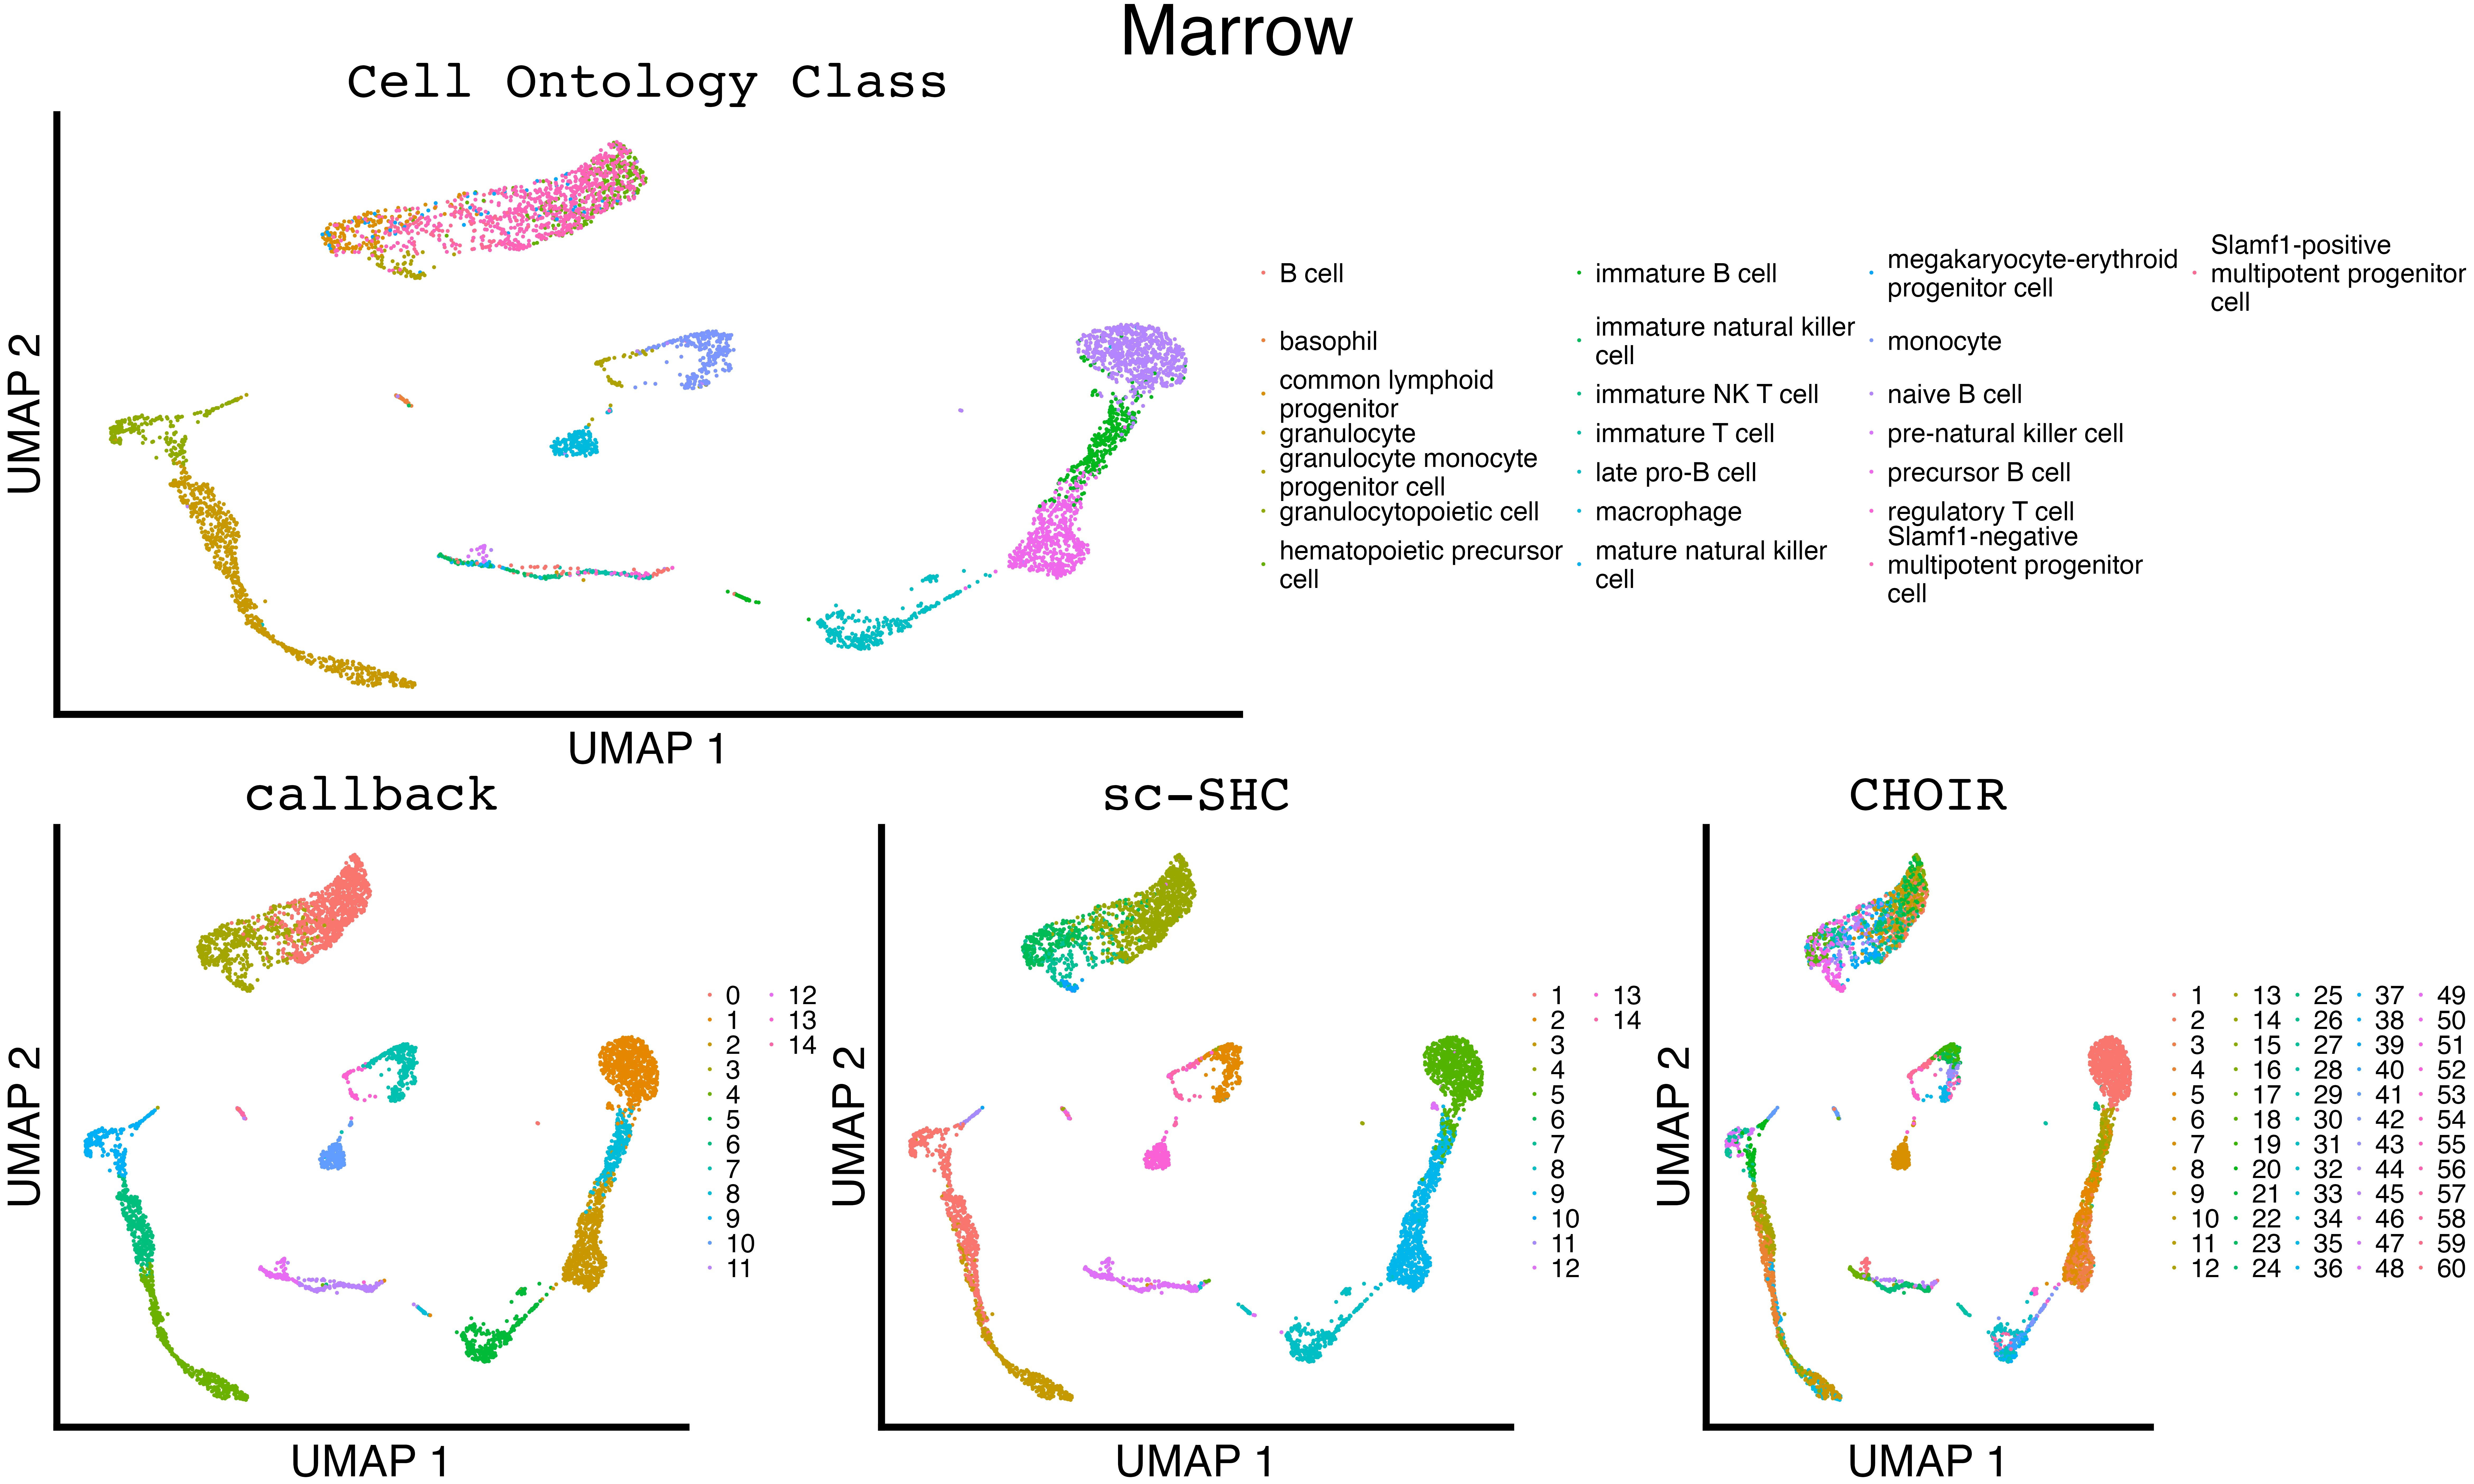
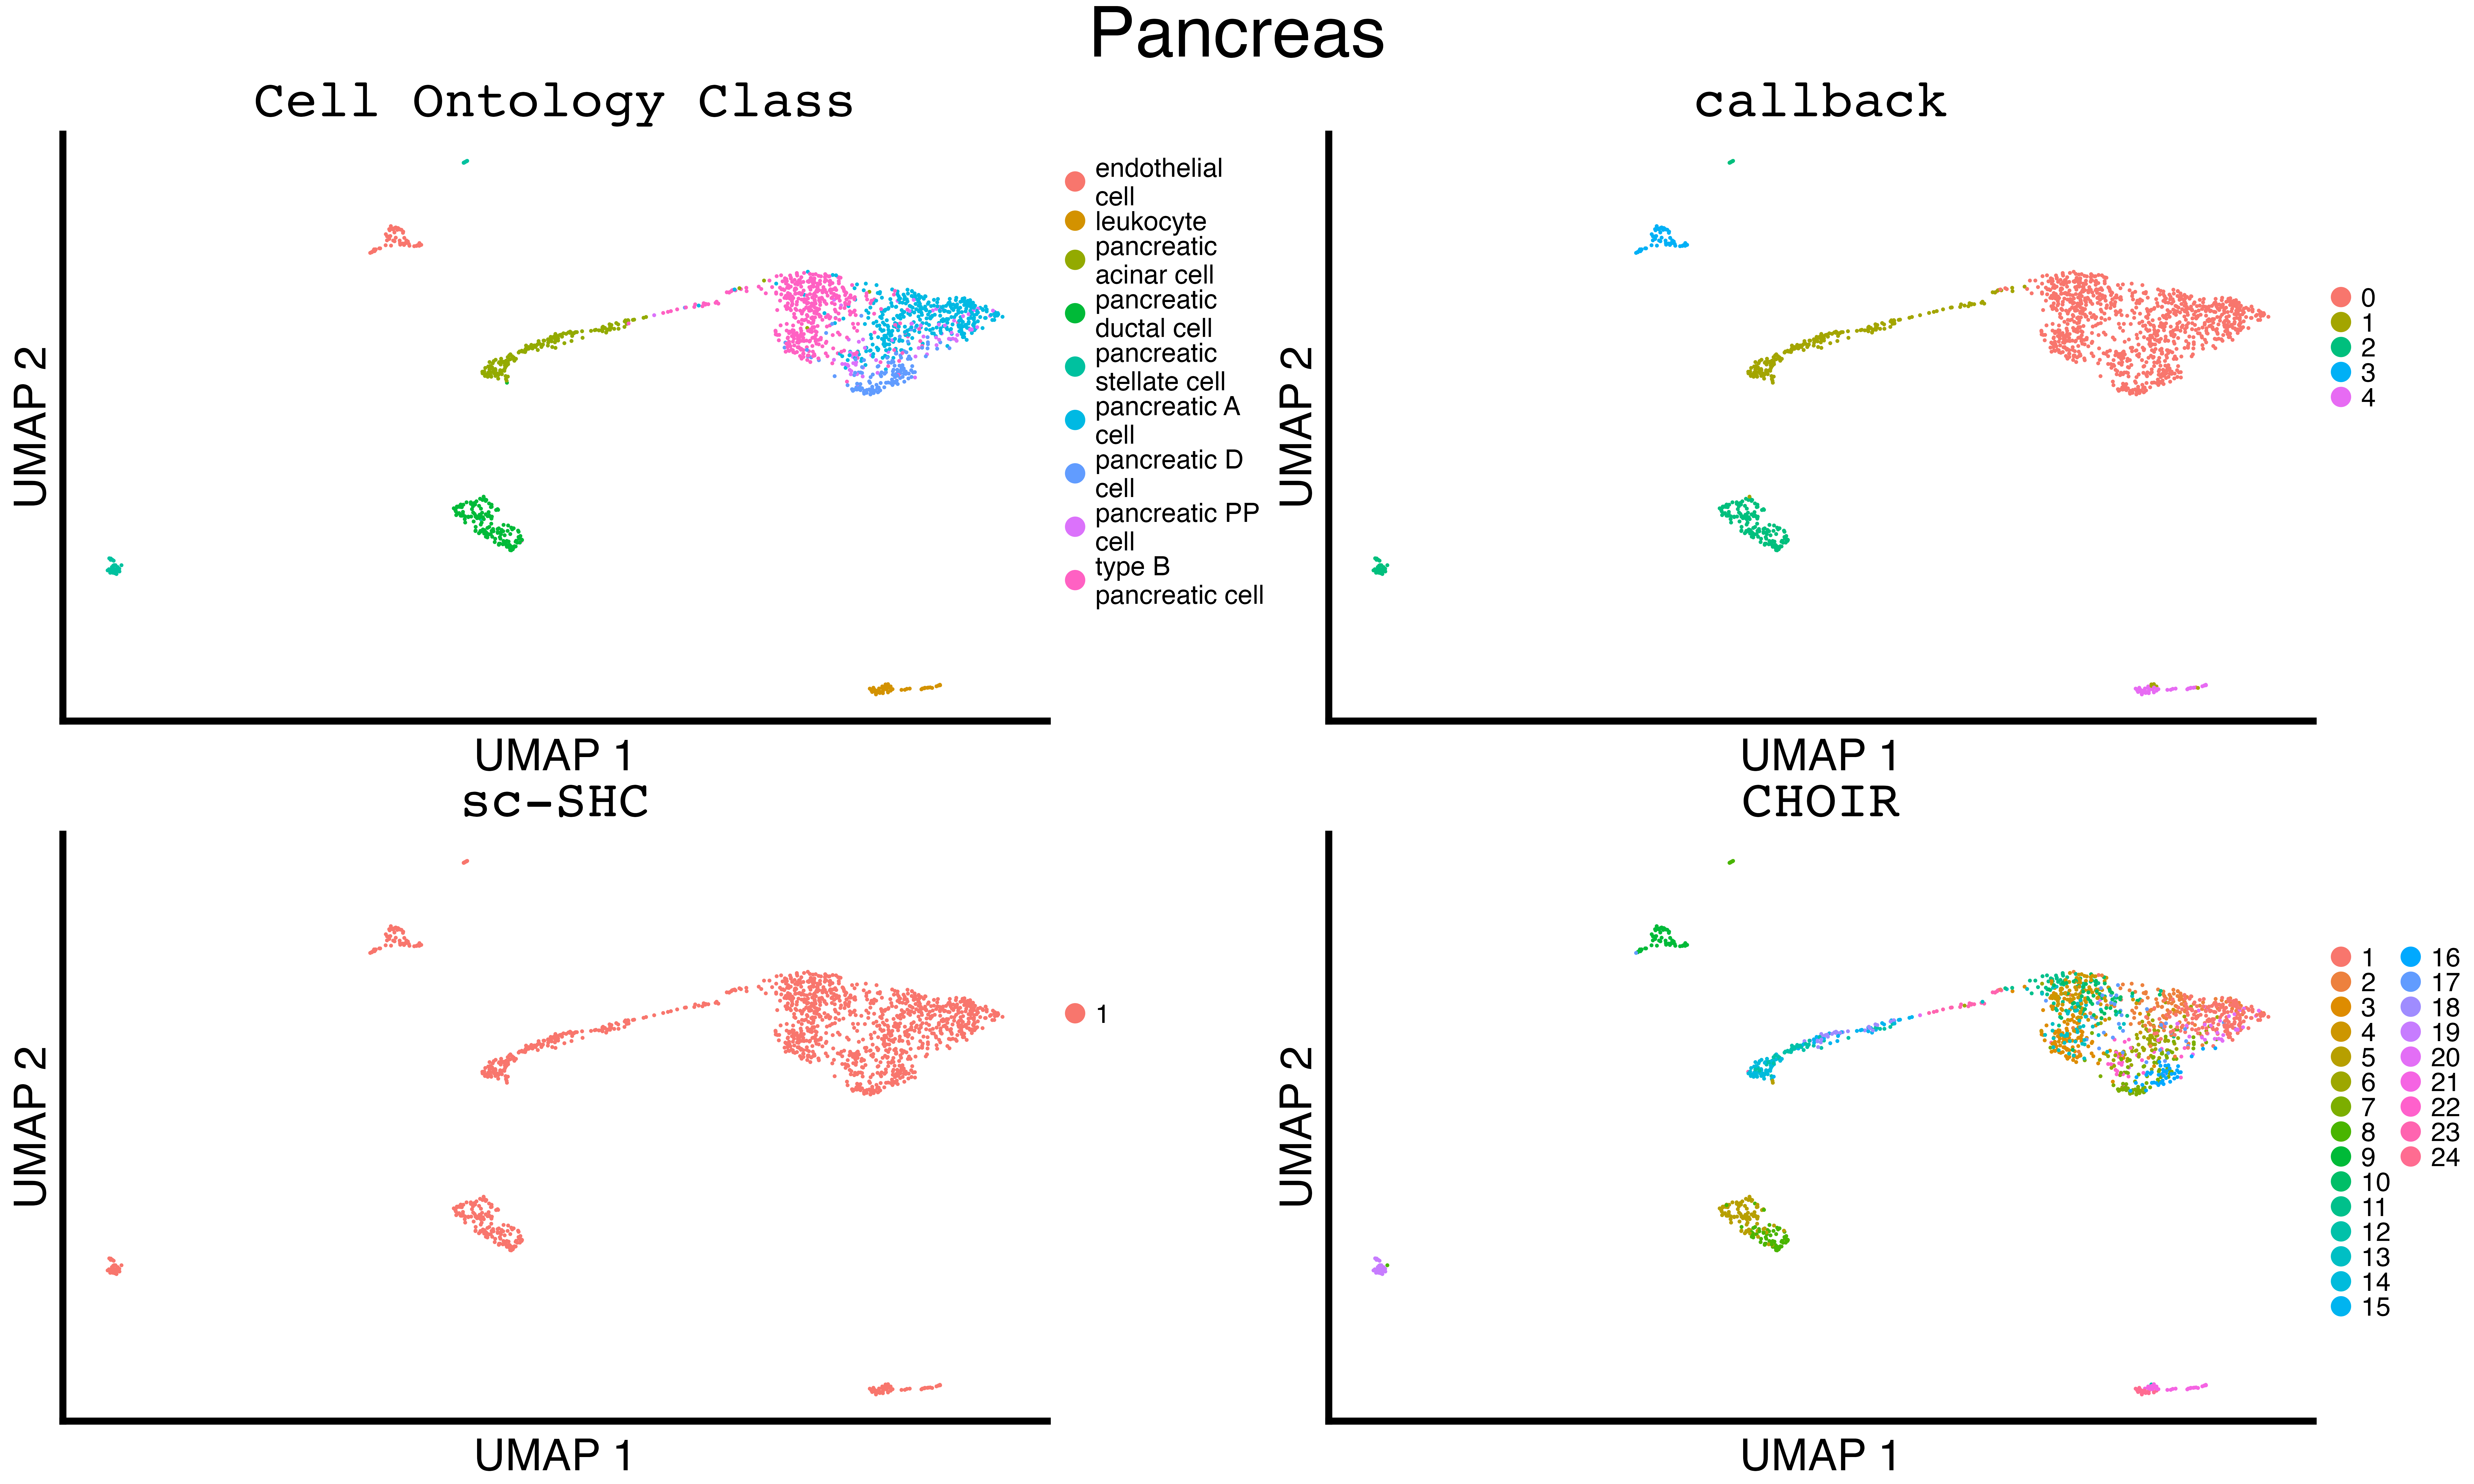
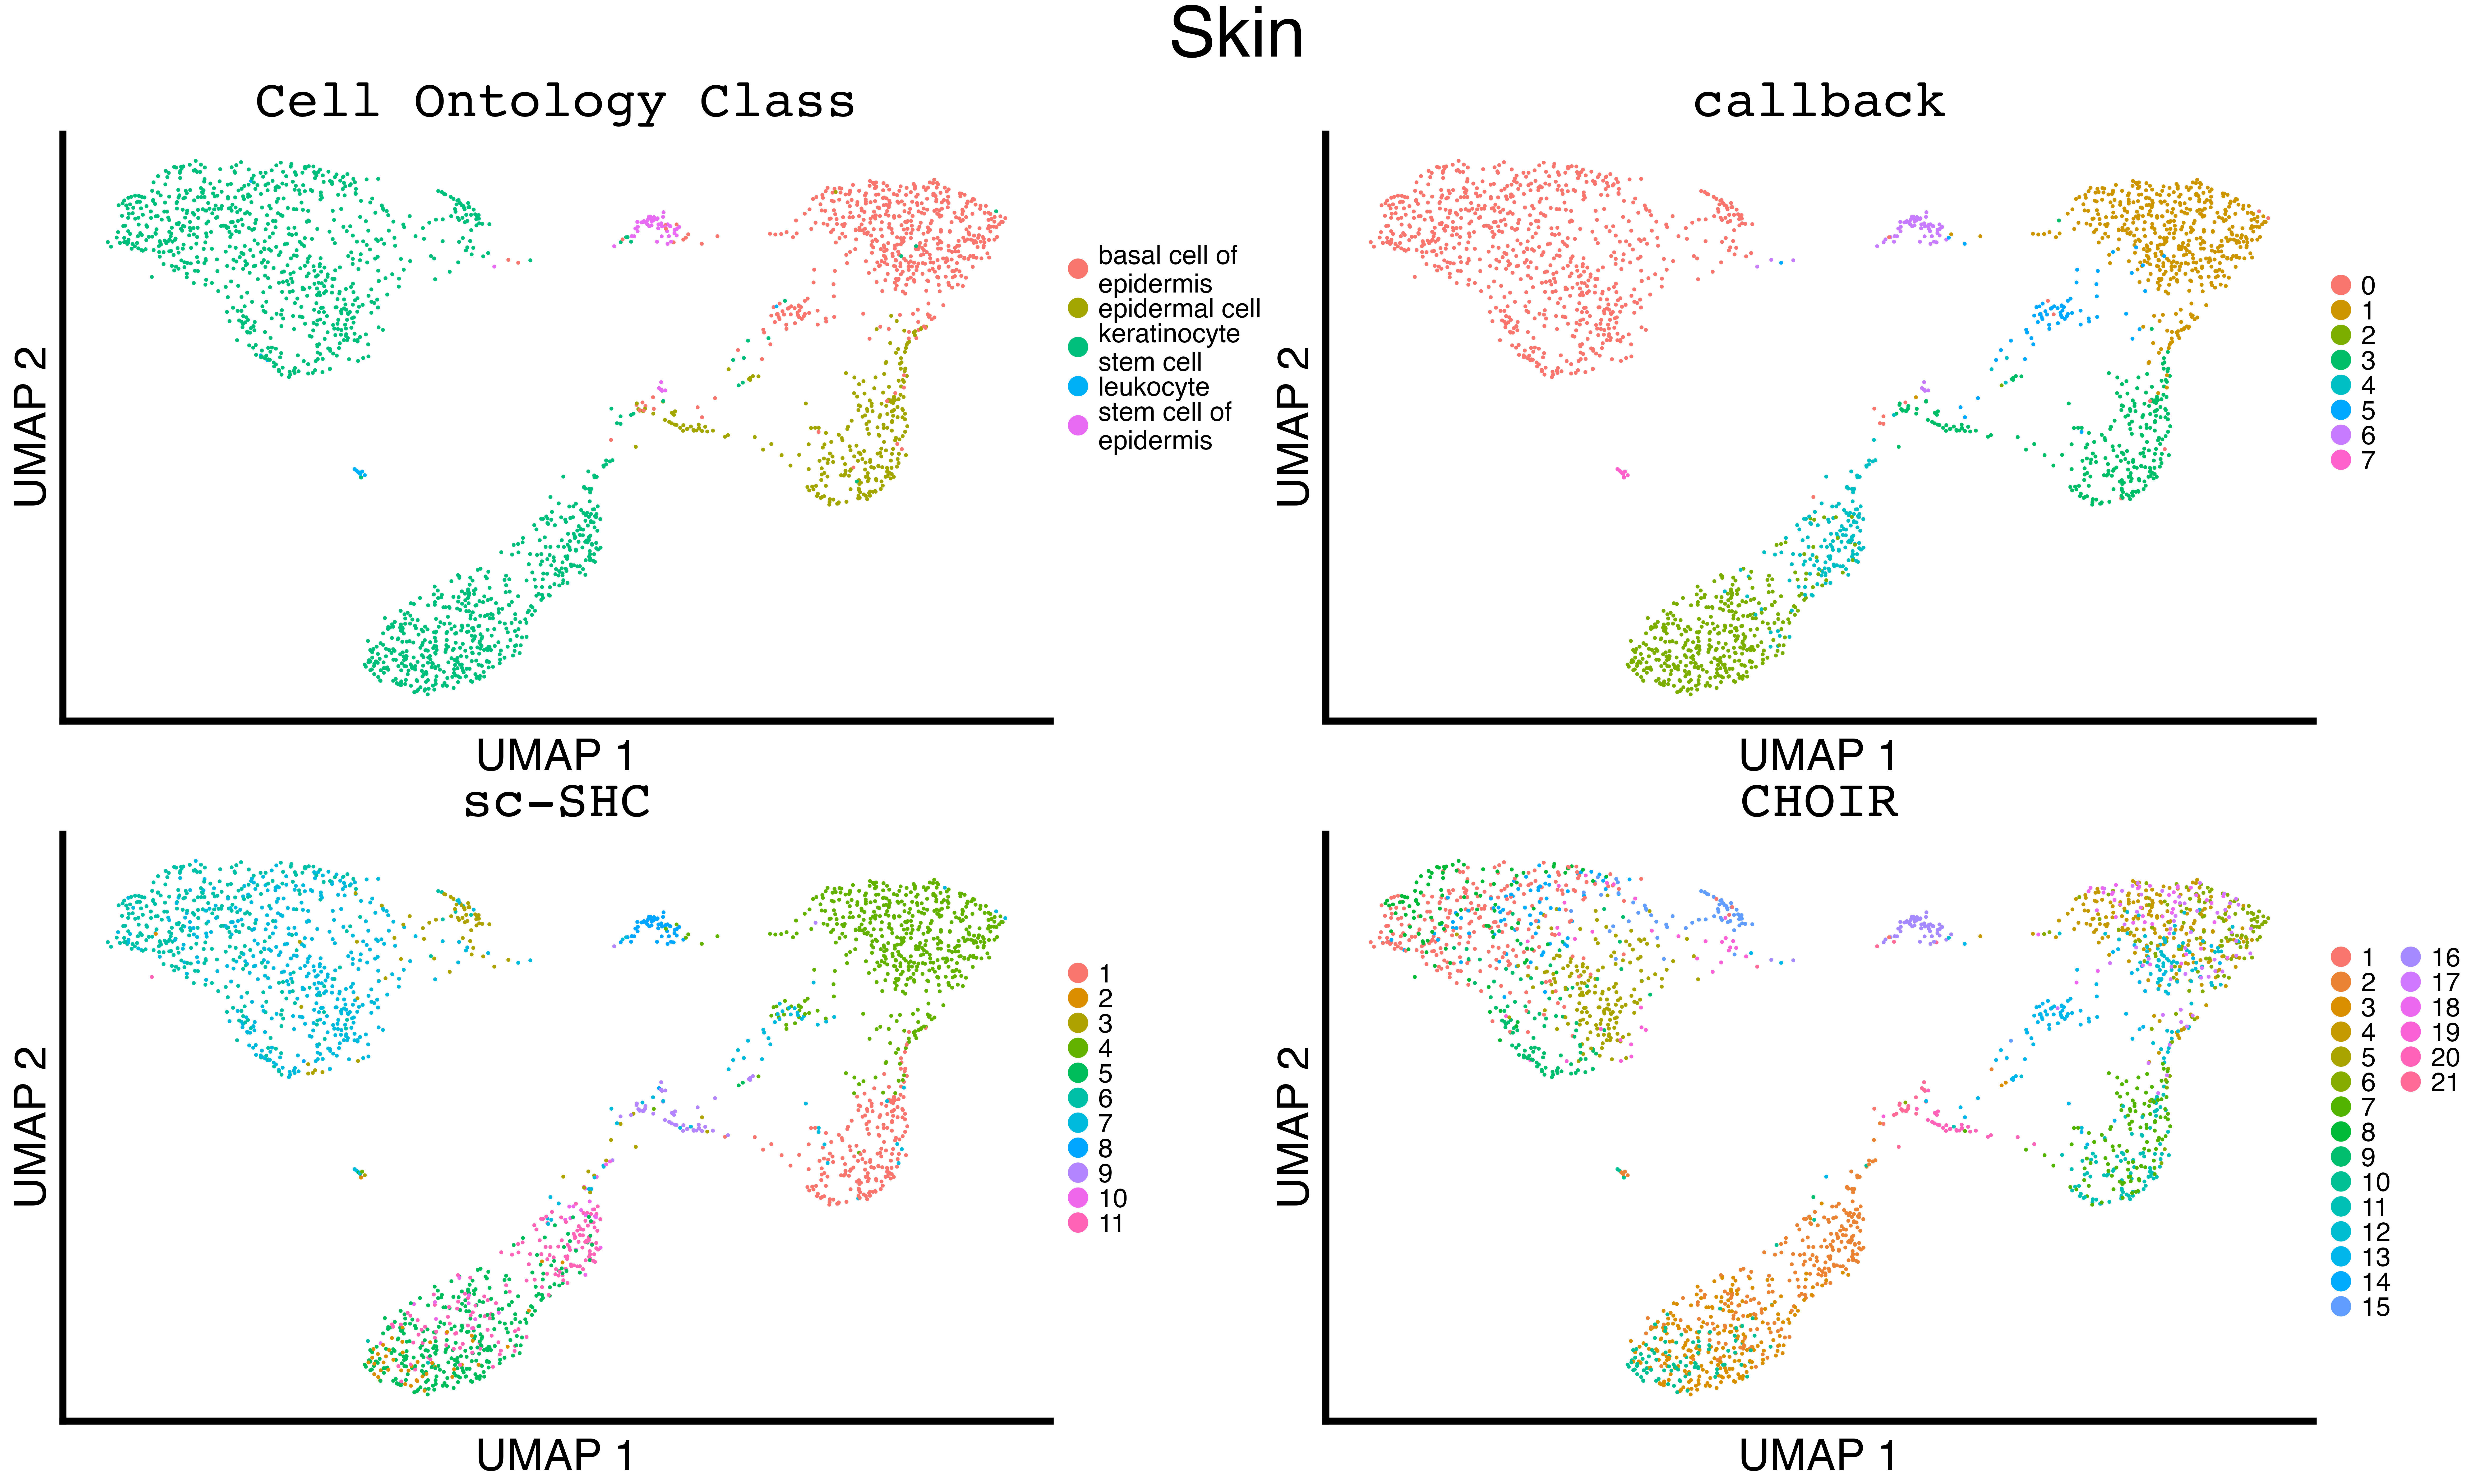
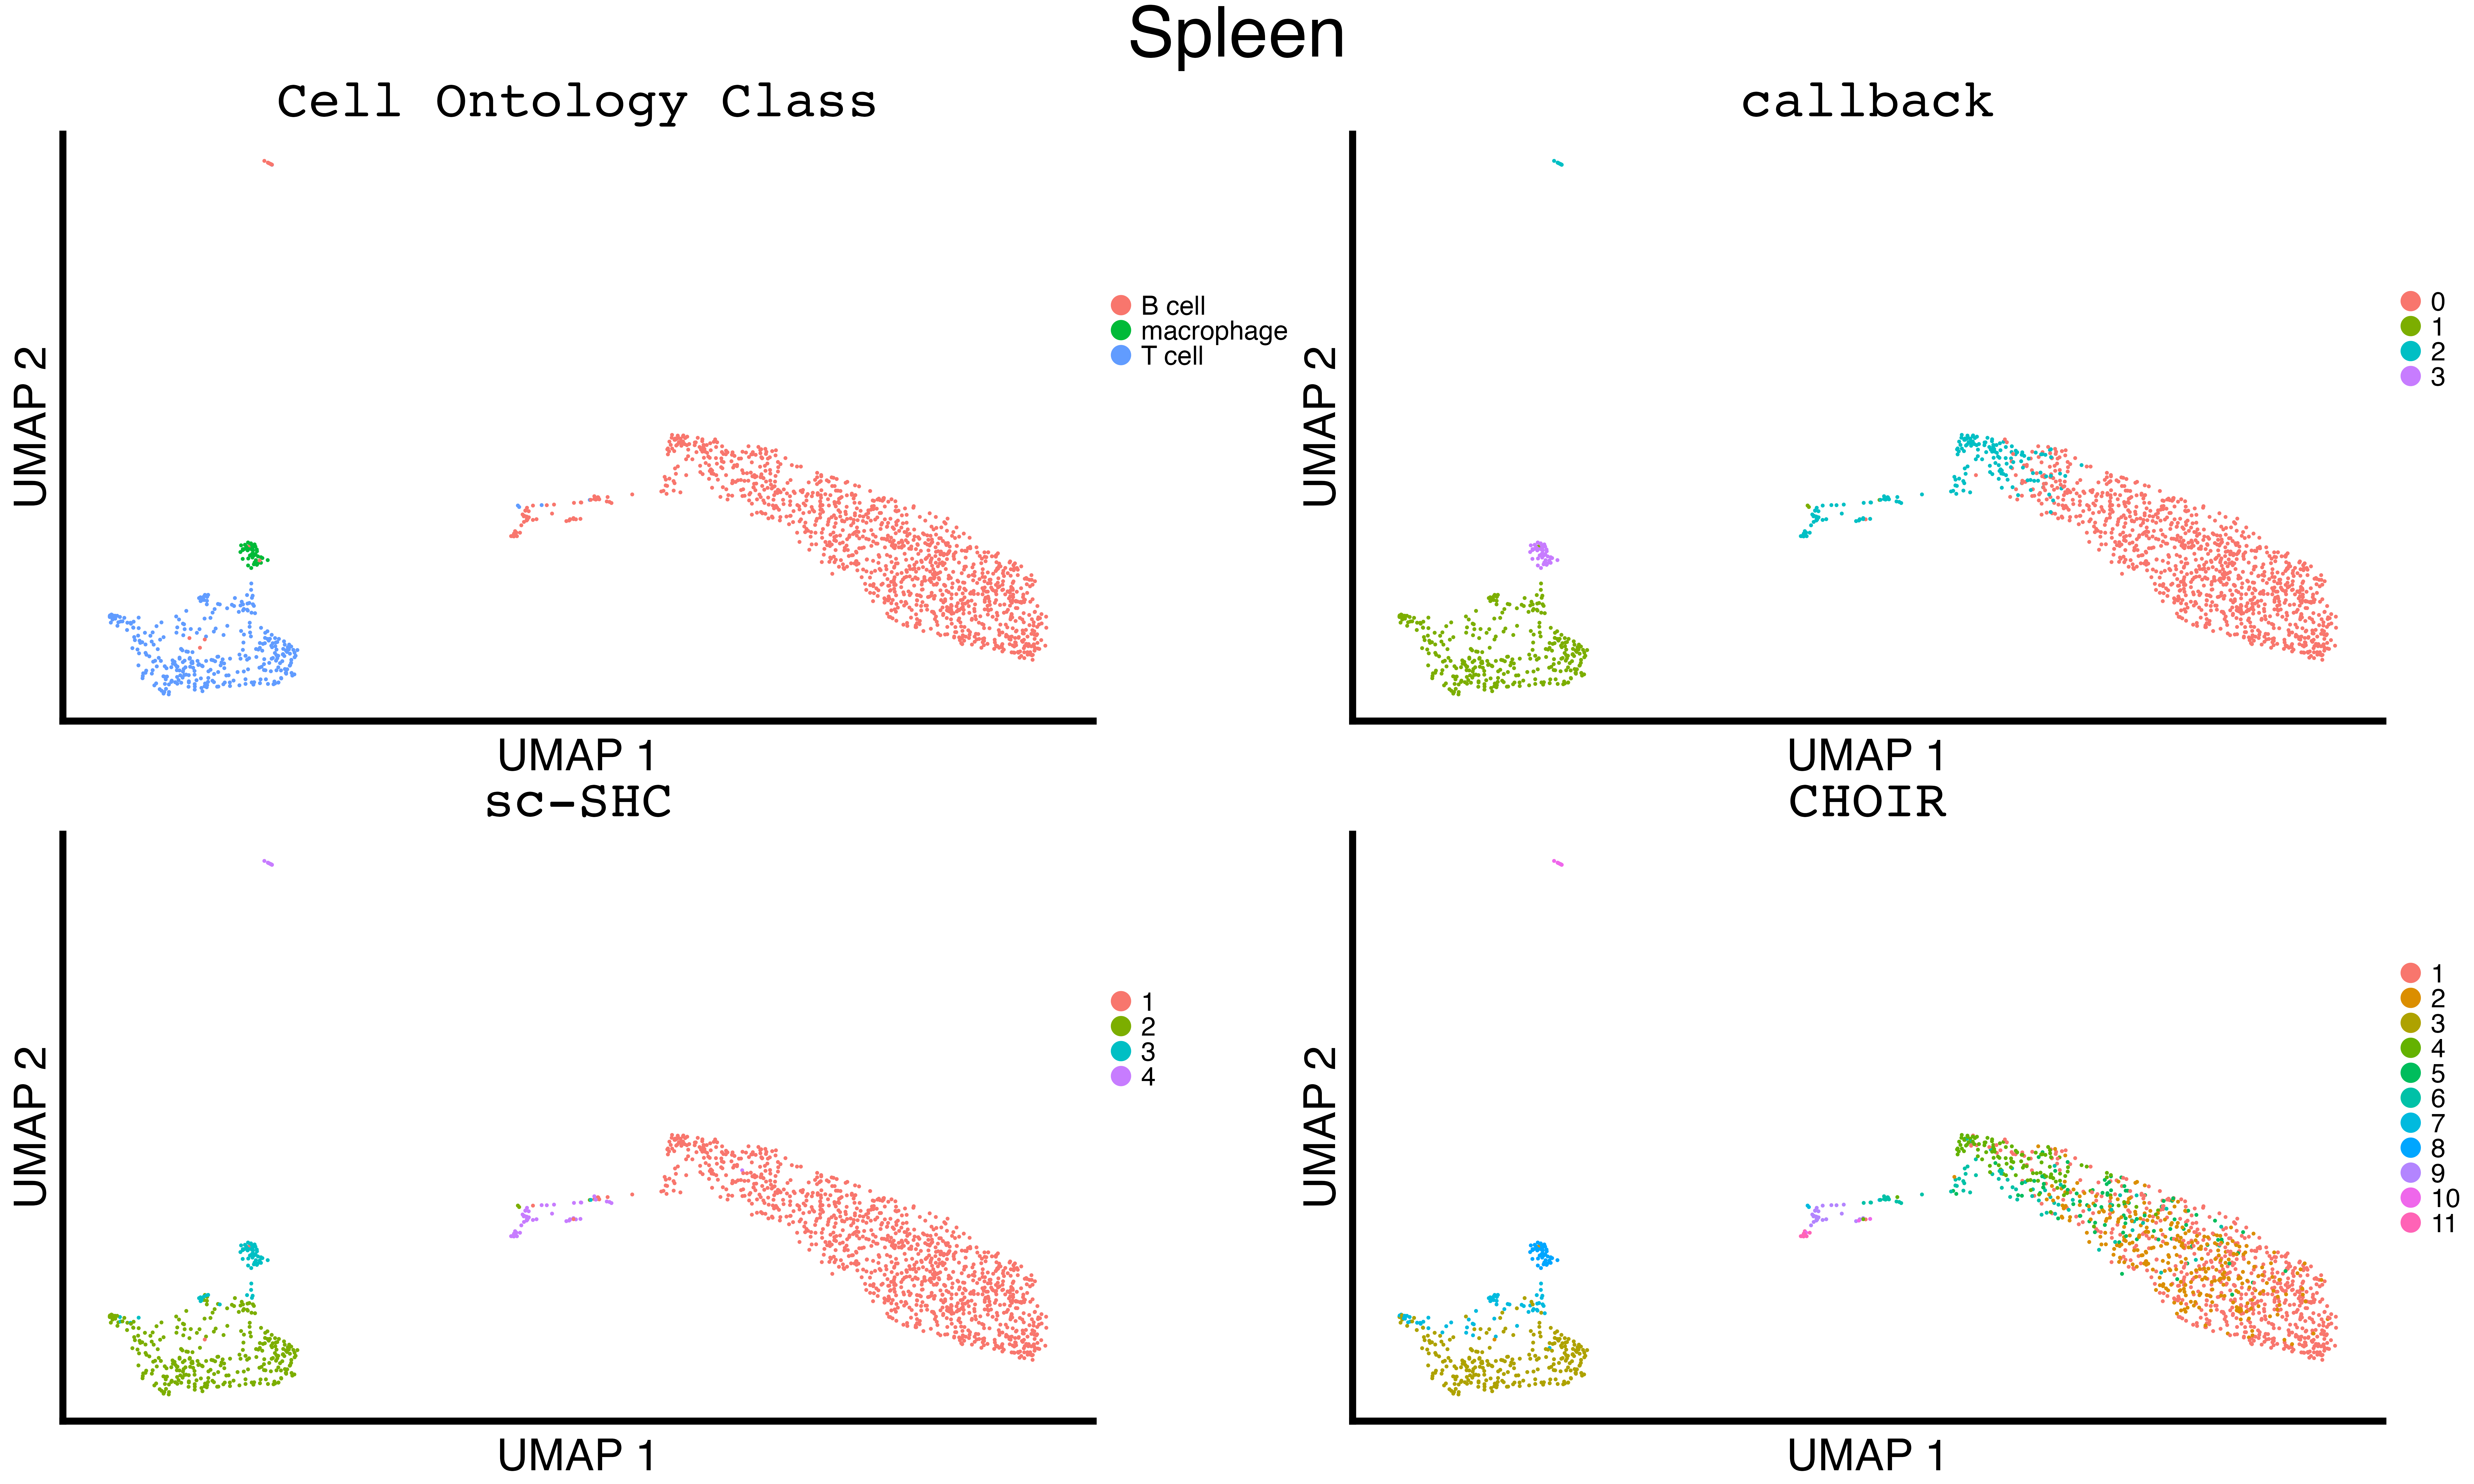
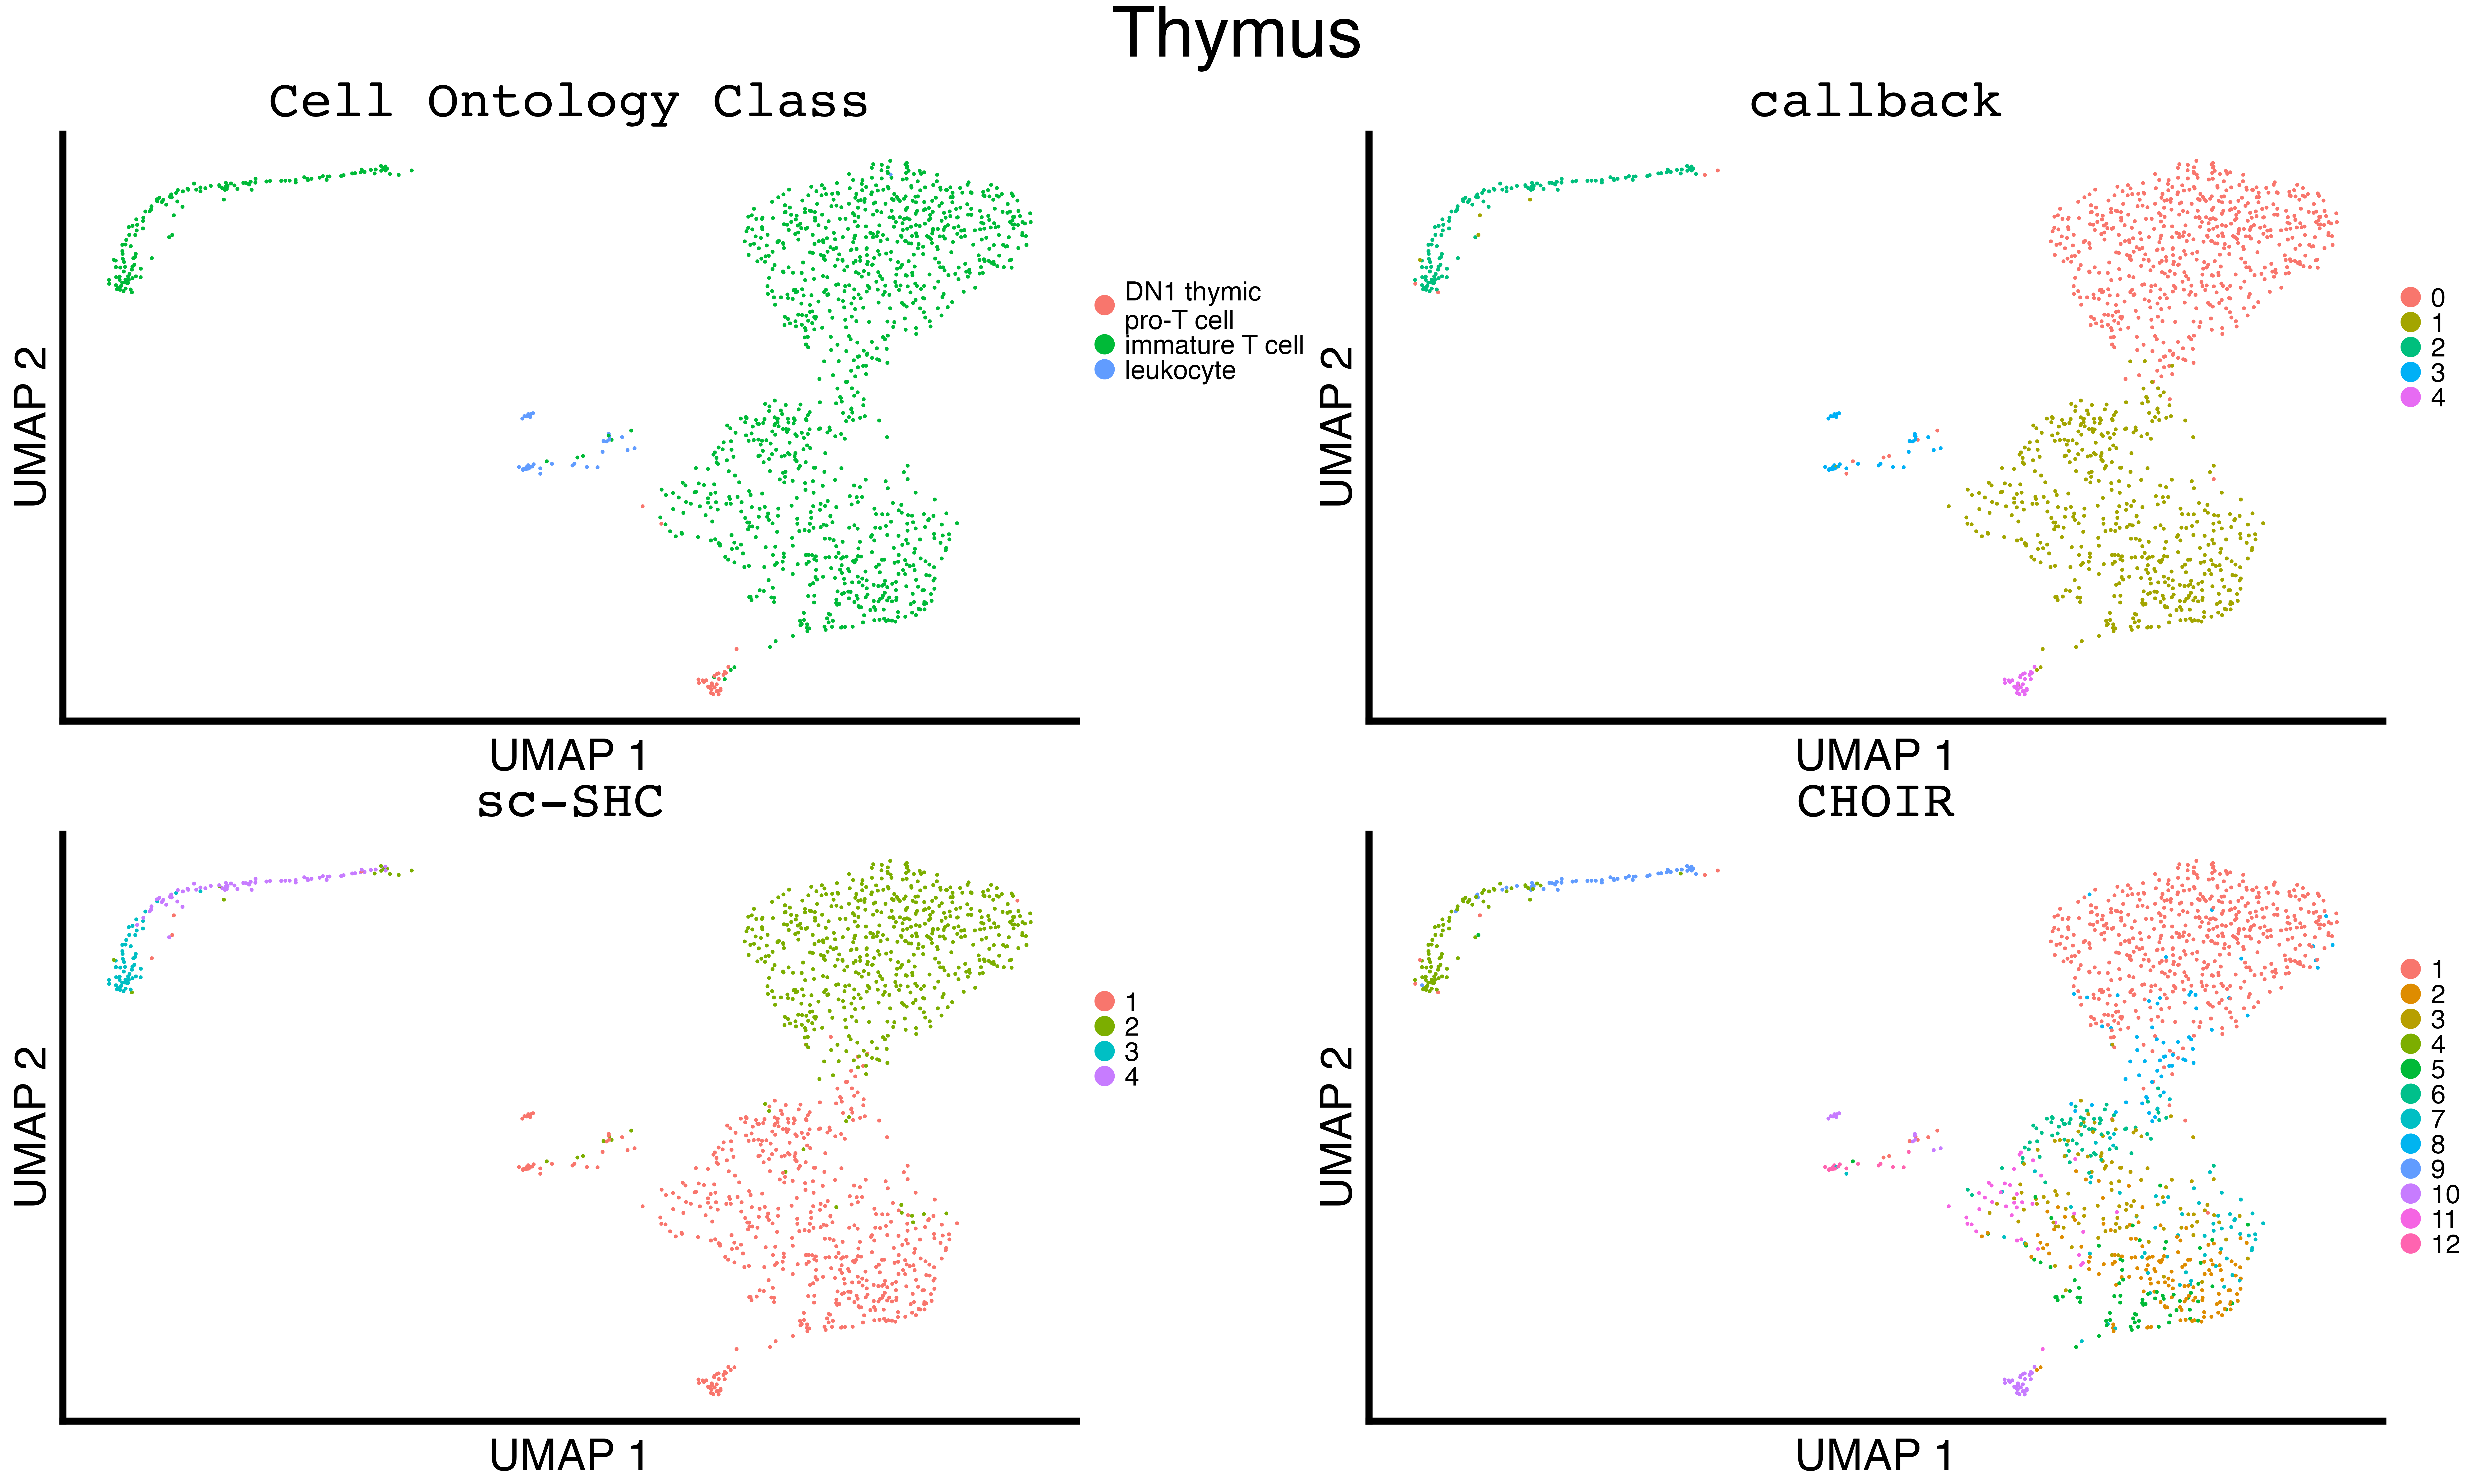
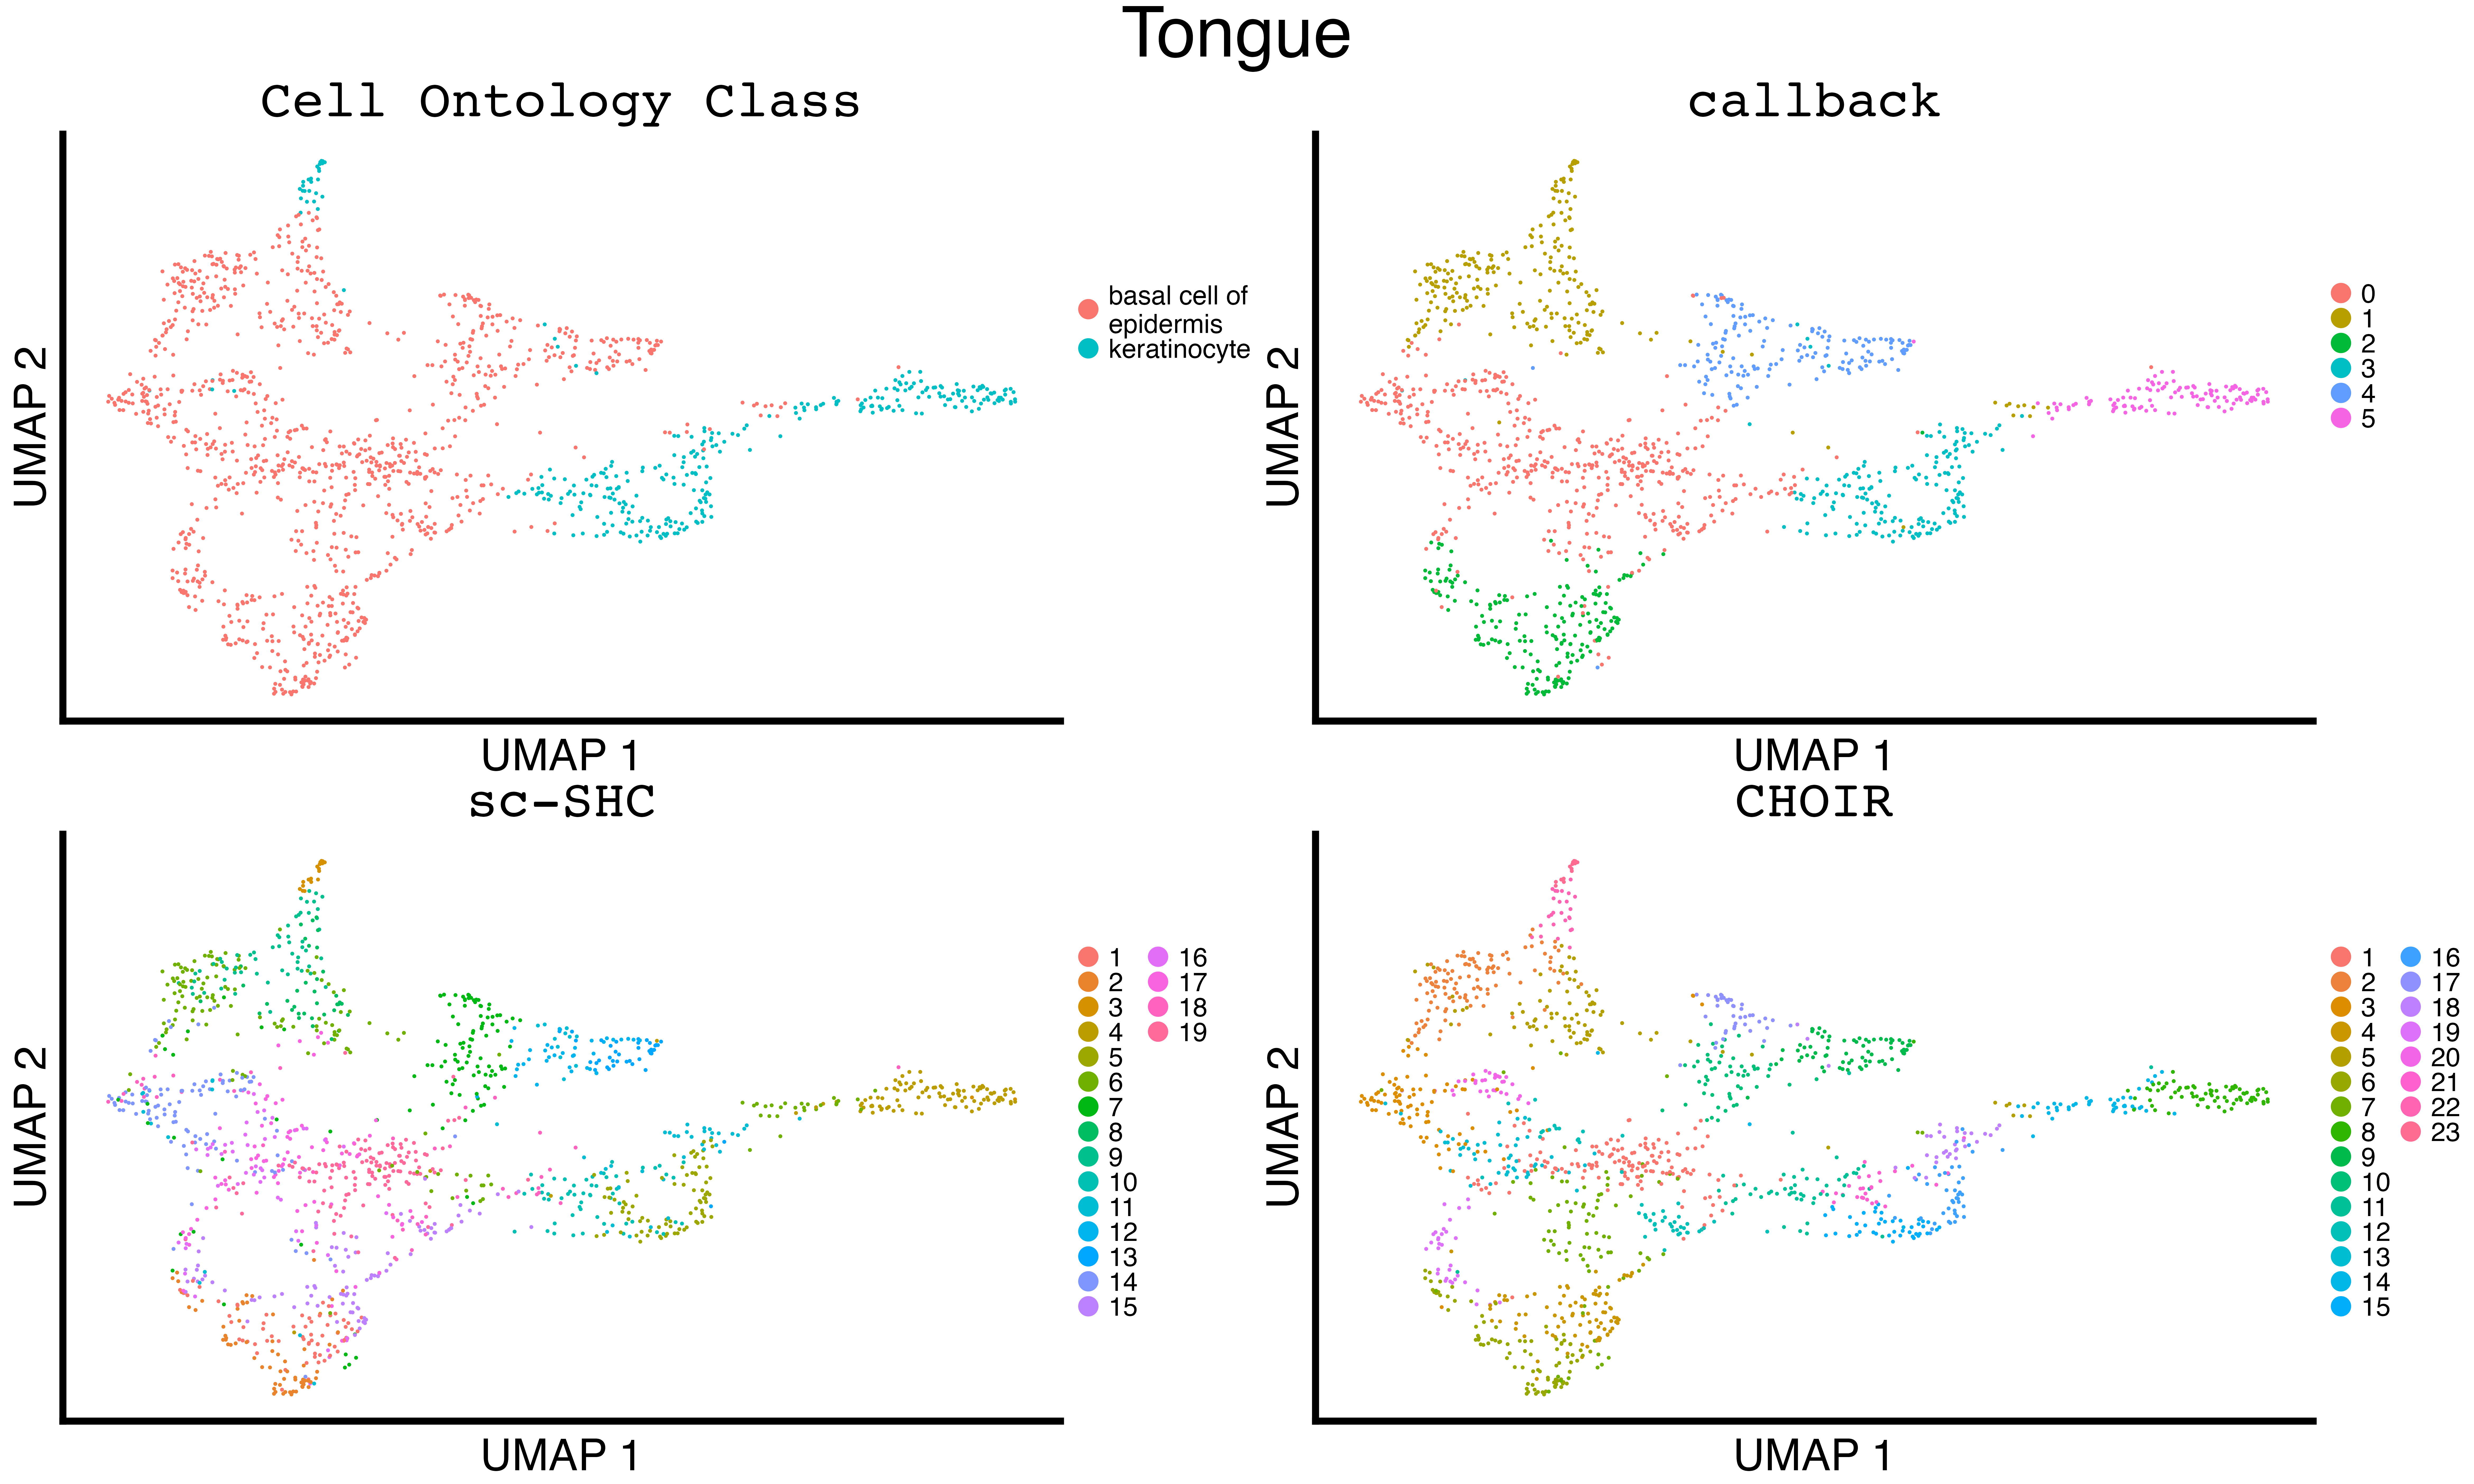
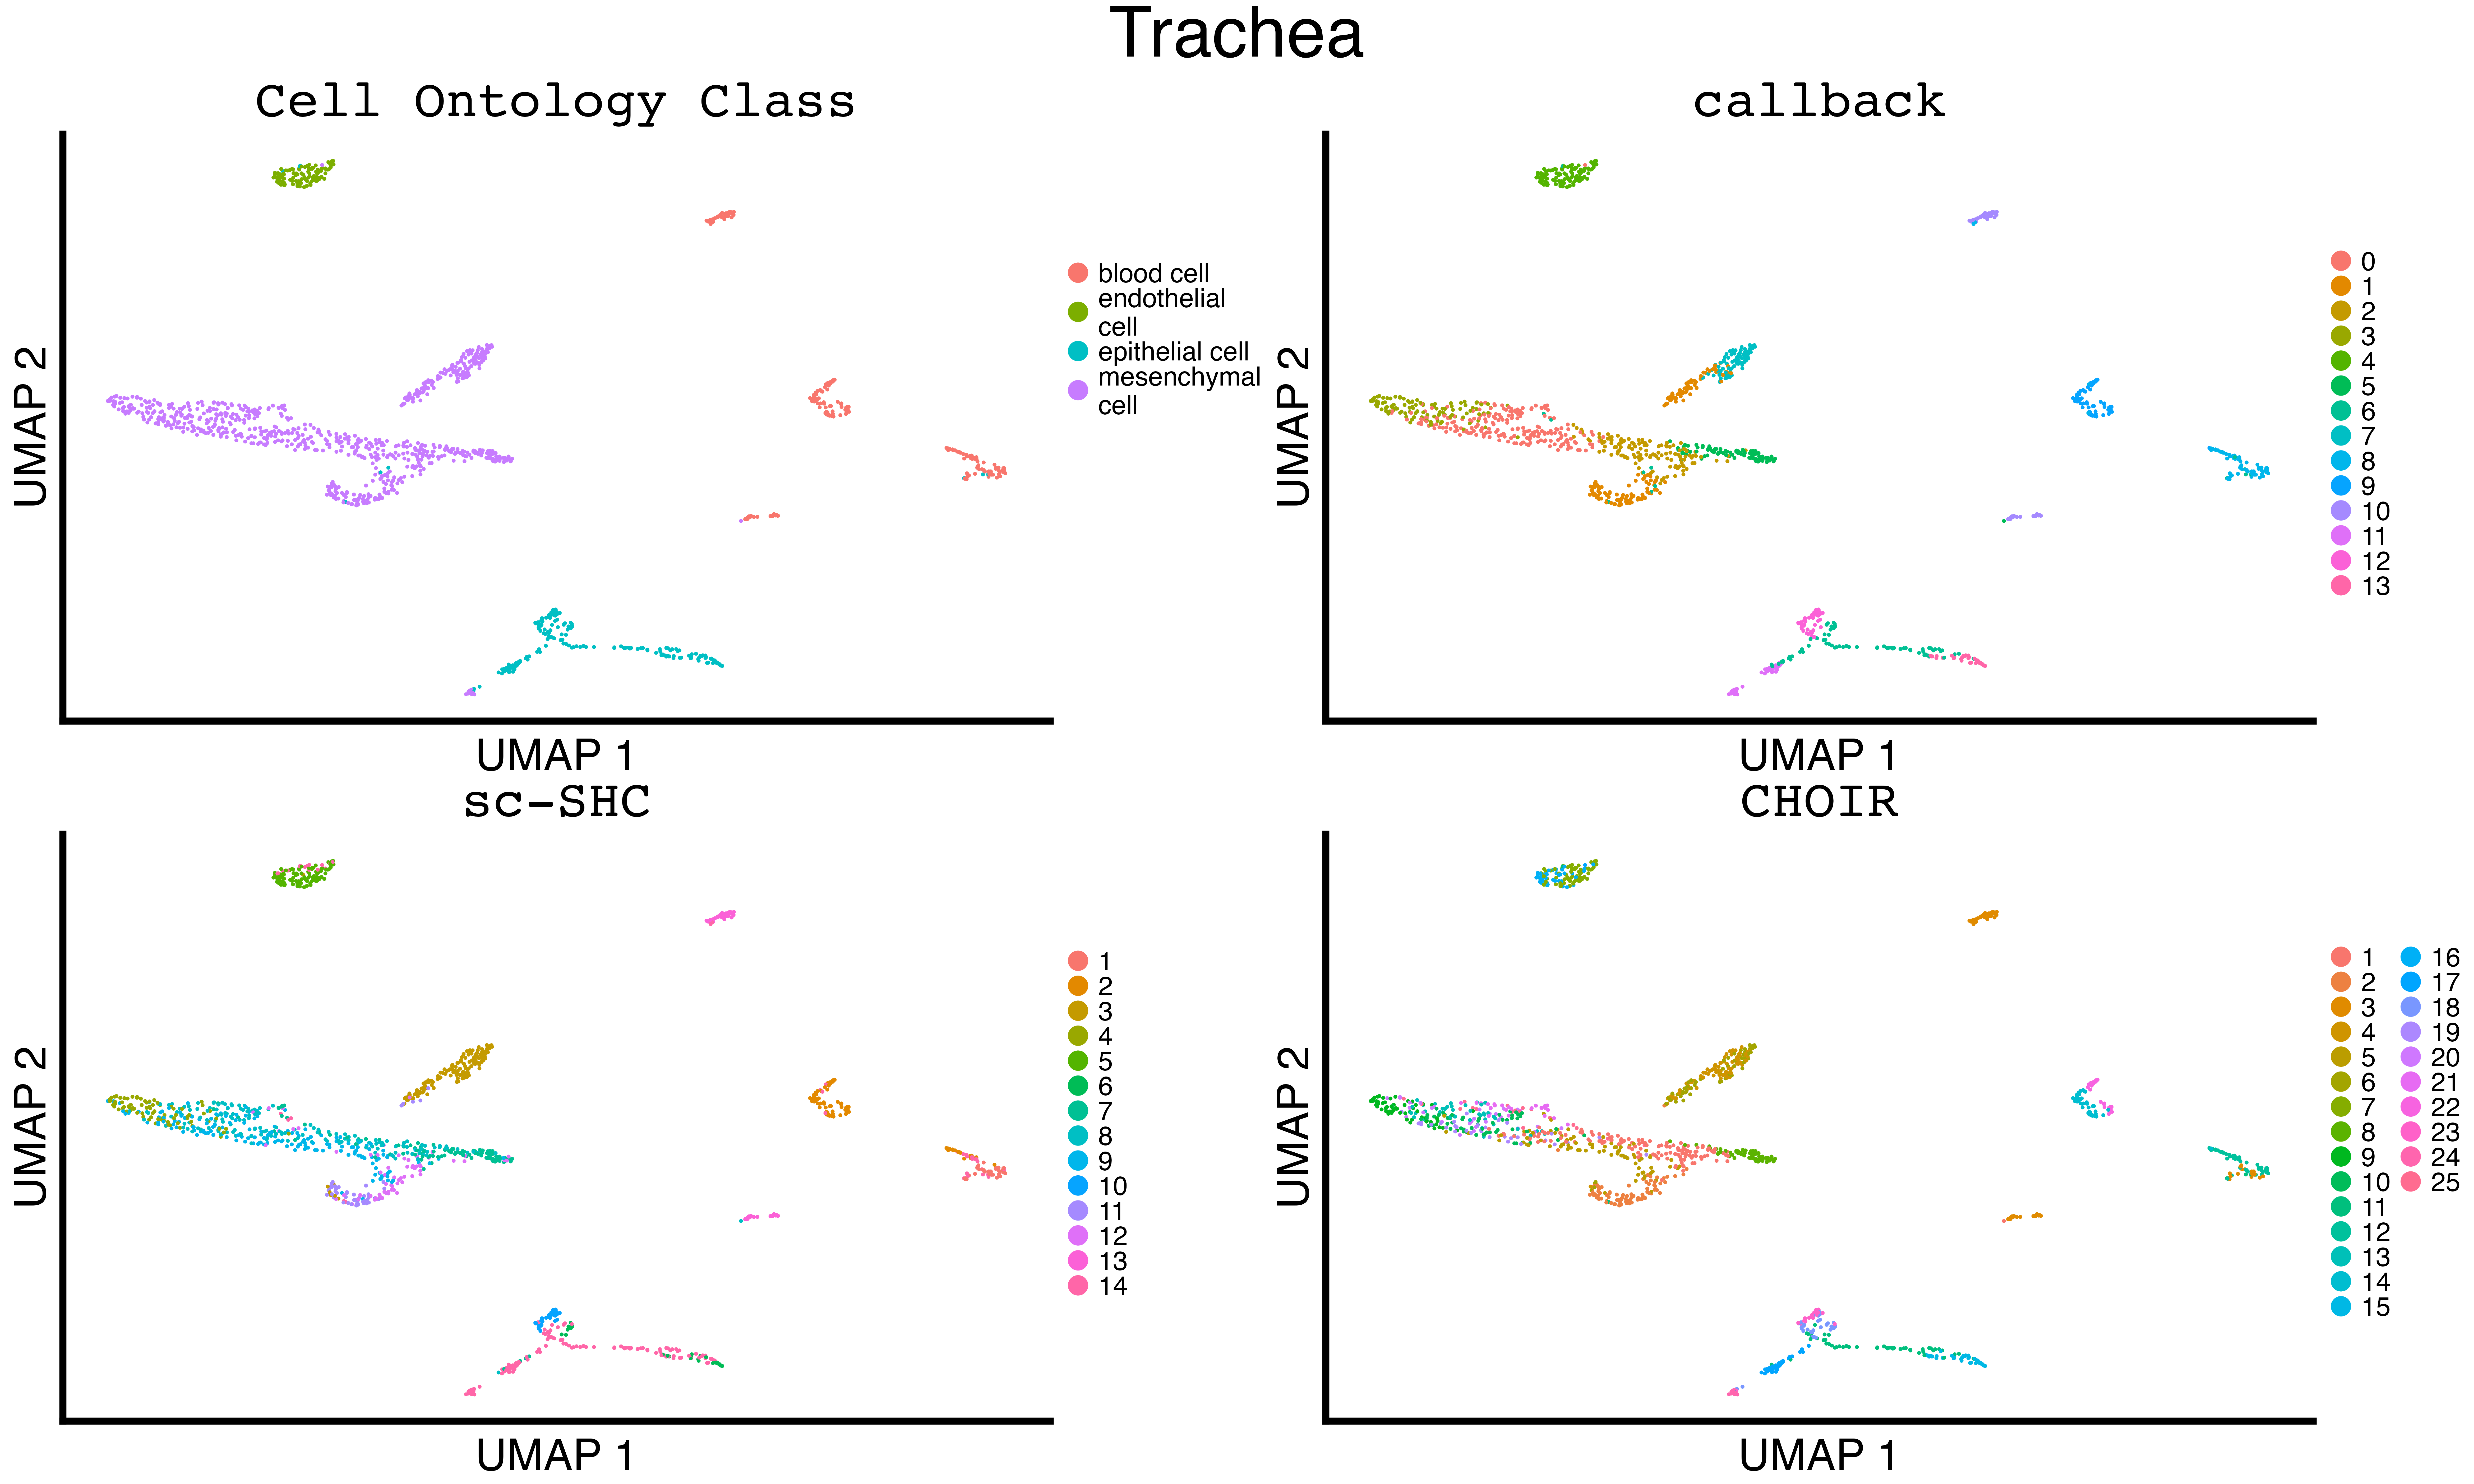
6. Plotting Tabula Muris UMAPs (Supplemental Figures S6-S25)
6_tissue_umaps.Rmd
suppressPackageStartupMessages({
library(callbackreproducibility)

library(Seurat)

library(ggplot2)
library(patchwork)
library(grid)
library(gridExtra)
})
Get the clustering results from running callback,
sc-SHC, and CHOIR.
tissue_seurat_files <- list.files(pattern = "cluster_results_seurat.rds")Loop over the clustering results and plot all of the UMAP grids.
for (tissue_rds_file in tissue_seurat_files) {

  tissue_name <- sub('cluster_results_seurat.rds', "", tissue_rds_file)

  print(tissue_name)

  tissue_seurat_obj <- readRDS(tissue_rds_file)

  if (tissue_name == "Heart") {
    # clean up cell type labels for heart
    tissue_seurat_obj@meta.data$cell_ontology_class[tissue_seurat_obj@meta.data$cell_ontology_class == ""] <- "cardiac neuron"
  }

  if (tissue_name == "Fat") {
    # clean up cell type labels for fat
    tissue_seurat_obj@meta.data$cell_ontology_class[tissue_seurat_obj@meta.data$cell_ontology_class == ""] <- "unlabeled"
  }

  if (tissue_name == "Lung") {
    # clean up cell type labels for heart
    tissue_seurat_obj@meta.data$cell_ontology_class[tissue_seurat_obj@meta.data$cell_ontology_class == ""] <- "unlabeled"
  }

  # make legends fit better
  legend_line_length <- 15

  if (tissue_name == "Lung") {
    legend_line_length <- 22
  }

  # make some cell types multiple lines
  tissue_seurat_obj@meta.data$cell_ontology_class <- stringr::str_wrap(tissue_seurat_obj@meta.data$cell_ontology_class, legend_line_length)

  # remove NAs
  tissue_seurat_obj <- subset(tissue_seurat_obj, subset = cell_ontology_class %in% levels(factor(tissue_seurat_obj@meta.data$cell_ontology_class)))


  umap_fig <- get_umap(tissue_seurat_obj, tissue_name)

  if (tissue_name == "Marrow") {

    legend_line_length <- 23

    tissue_seurat_obj@meta.data$cell_ontology_class <- stringr::str_wrap(tissue_seurat_obj@meta.data$cell_ontology_class, legend_line_length)

    layout <- "AAA###\nAAA###\nBBCCDD\nBBCCDD"

    marrow_ontology <- one_umap(tissue_seurat_obj, "cell_ontology_class", "Cell Ontology Class", add_legend=TRUE) + guides(color=guide_legend(nrow=7))

    marrow_callback <- one_umap(tissue_seurat_obj, "callback_idents", "callback", add_legend=TRUE) + guides(color=guide_legend(nrow=12))
    marrow_scSHC <- one_umap(tissue_seurat_obj, "scSHC_clusters", "sc-SHC", add_legend=TRUE) + guides(color=guide_legend(nrow=12))
    marrow_CHOIR <- one_umap(tissue_seurat_obj, "CHOIR_clusters_0.05", "CHOIR", add_legend=TRUE) + guides(color=guide_legend(nrow=12))


    umap_fig <- marrow_ontology +
      marrow_callback +
      marrow_scSHC +
      marrow_CHOIR +
      plot_layout(design = layout) +
      plot_annotation(title = tissue_name,
                      theme = theme(plot.title = element_text(size = 64, hjust = 0.5)))

    #umap_fig <- grid.arrange(
    umap_fig <- arrangeGrob(
      marrow_ontology, marrow_callback, marrow_scSHC, marrow_CHOIR,
      #  widths = c(2, 1, 1),
      top=textGrob("Marrow", gp=gpar(fontsize = 64, hjust = 0.5, vjust = 1.0)),
      layout_matrix = rbind(c(1, 1, 1),
                            c(2, 3, 4))
    )

  }

  ggsave(paste0(tissue_name, "_umap.png"), plot = umap_fig, height = 1.3 * 3 * 1440, width = 1.3 * 5 * 1440, units = "px")
}